Skip to content
EXPLORATIONS IN DATA STORYTELLING WITH POWER BI

EXPLORATIONS IN DATA STORYTELLING WITH POWER BI

  • Home
  • Visualisations
  • Templates
    • Deneb Templates
    • SVG Templates
    • PlotlyJS Templates
  • About
  • LinkedIn
  • Twitter
  • YouTube
  • Instagram

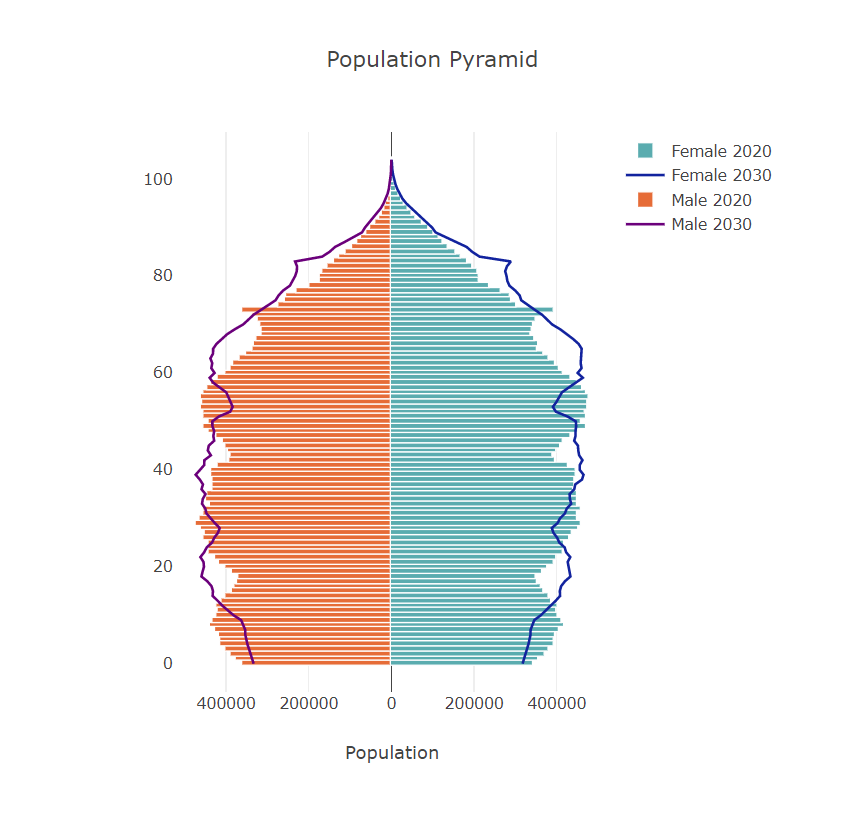
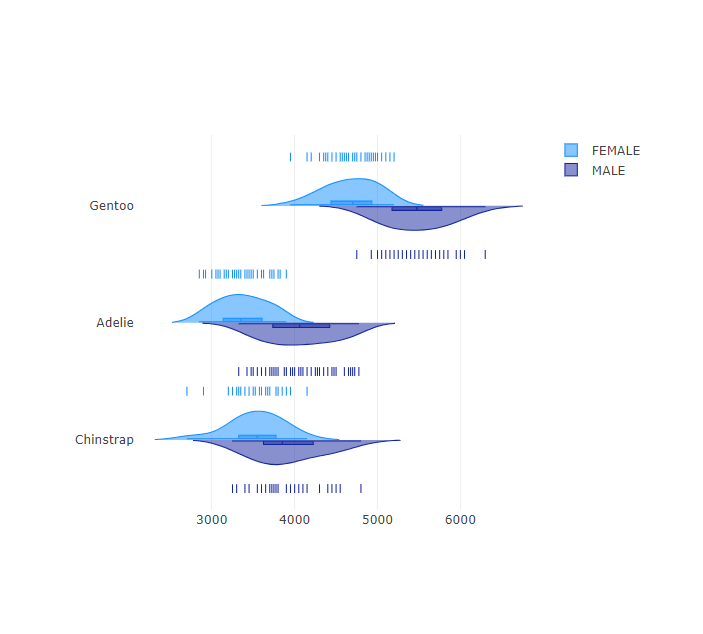
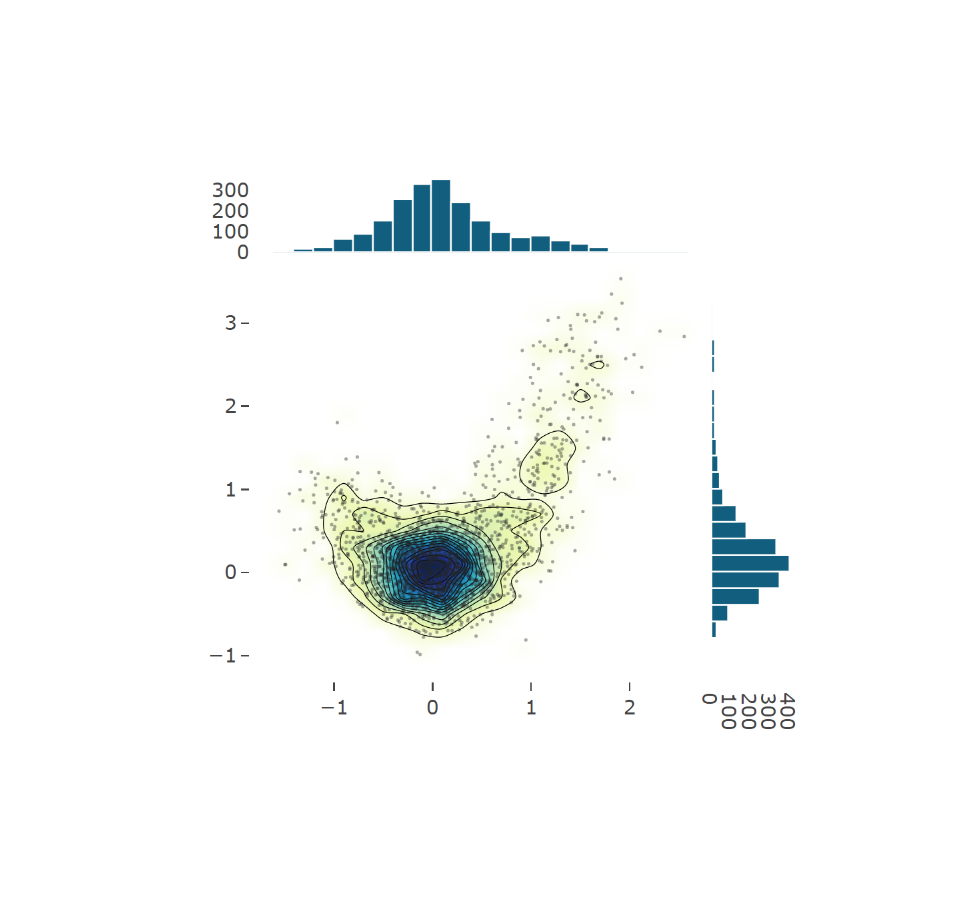
Chart Templates

Templates for various Power BI custom visuals including Deneb and PlotlyJS. Learn how to import a template here. More templates and .pbix files here.

Visual Portfolio, Posts & Image Gallery for WordPress
All
Deneb Templates
PlotlyJS
SVG Templates

poppyr

PlotlyJS

Population Pyramid

split violin

PlotlyJS

Split Violin

plotlycontour

contour plot
PlotlyJS

Contour Histogram

Load More Loading More… You’ve reached the end of the list

Post navigation

Previous post

Visualisations

Next post

Ramblings

Recent Posts

  • KPI trend indicators on Core Visuals
  • Visualise Filters Applied
  • Custom path axis with Charticulator
  • Breaking the Rules
  • Convert to Shape

Archives

Categories

EXPLORATIONS IN DATA STORYTELLING WITH POWER BI