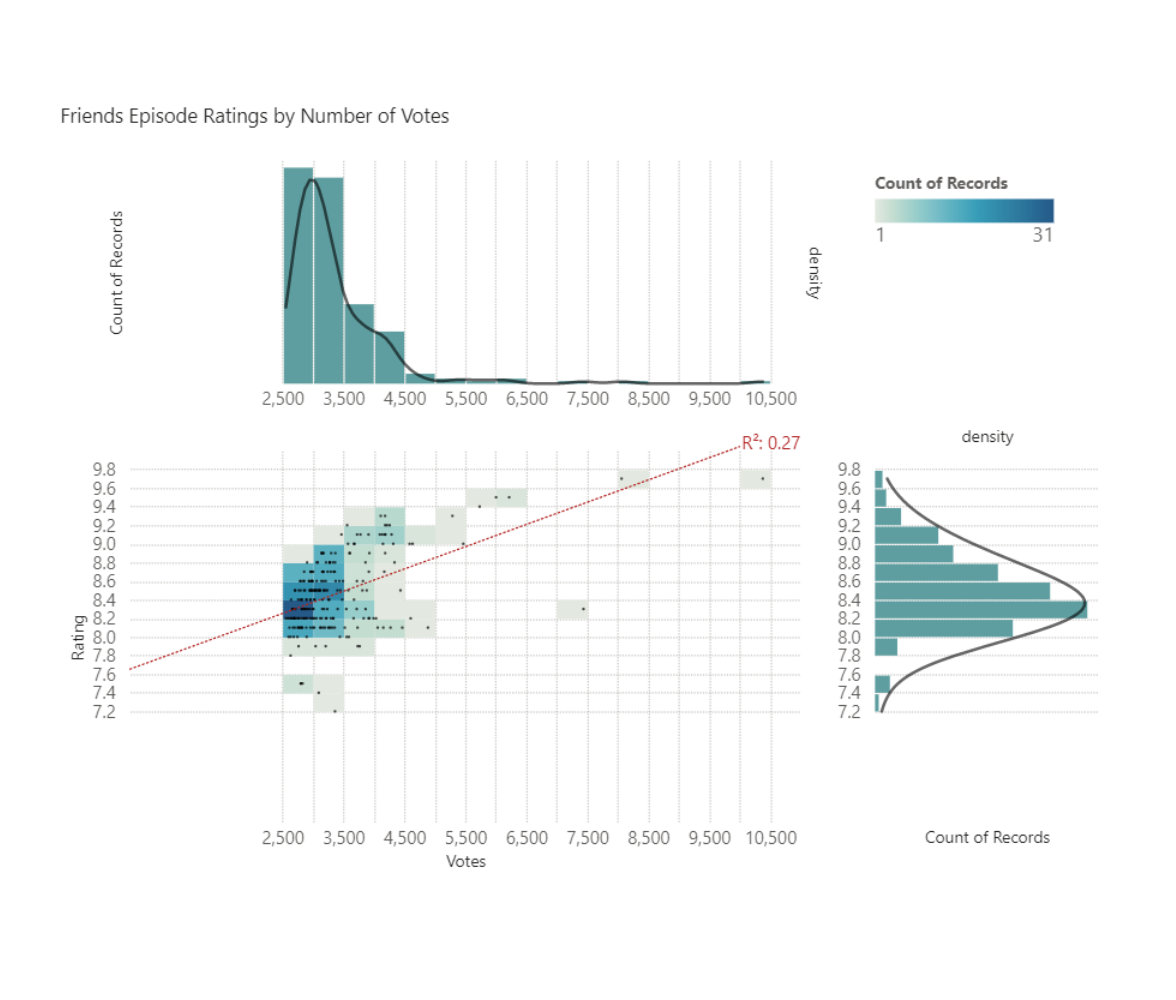
{
  "$schema": "https://vega.github.io/schema/vega-lite/v5.json",
  "usermeta": {
    "deneb": {
      "build": "1.2.0.1",
      "metaVersion": 1,
      "provider": "vegaLite",
      "providerVersion": "5.2.0"
    },
    "interactivity": {
      "tooltip": true,
      "contextMenu": true,
      "selection": false,
      "highlight": false,
      "dataPointLimit": 50
    },
    "information": {
      "name": "Composite Scatter Bin",
      "description": "[No Description Provided]",
      "author": "Kerry Kolosko",
      "uuid": "82f3dd23-24e9-4456-b237-d56b7a08536d",
      "generated": "2022-06-12T12:02:33.154Z"
    },
    "dataset": [
      {
        "key": "__0__",
        "name": "Y",
        "description": "",
        "type": "numeric",
        "kind": "column"
      },
      {
        "key": "__1__",
        "name": "X",
        "description": "",
        "type": "numeric",
        "kind": "column"
      },
      {
        "key": "__2__",
        "name": "Random",
        "description": "",
        "type": "numeric",
        "kind": "measure"
      }
    ]
  },
  "config": {
    "autosize": {
      "type": "fit",
      "contains": "padding"
    },
    "view": {"stroke": "transparent"},
    "font": "Segoe UI",
    "arc": {},
    "area": {
      "line": true,
      "opacity": 0.6
    },
    "bar": {},
    "line": {
      "strokeWidth": 3,
      "strokeCap": "round",
      "strokeJoin": "round"
    },
    "path": {},
    "point": {
      "filled": true,
      "size": 75
    },
    "rect": {},
    "shape": {},
    "symbol": {
      "strokeWidth": 1.5,
      "size": 50
    },
    "text": {
      "font": "Segoe UI",
      "fontSize": 12,
      "fill": "#605E5C"
    },
    "axis": {
      "ticks": false,
      "grid": false,
      "domain": false,
      "labelColor": "#605E5C",
      "labelFontSize": 12,
      "titleFont": "Segoe UI",
      "titleColor": "#252423",
      "titleFontSize": 11,
      "titleFontWeight": "normal"
    },
    "axisQuantitative": {
      "tickCount": 20,
      "grid": true,
      "gridColor": "#C8C6C4",
      "gridDash": [1, 1],
      "labelFlush": false,
      "zindex": 0
    },
    "axisBand": {"tickExtra": true},
    "axisX": {"labelPadding": 5},
    "axisY": {"labelPadding": 10},
    "header": {
      "titleFont": "Segoe UI",
      "titleFontSize": 16,
      "titleColor": "#252423",
      "labelFont": "Segoe UI",
      "labelFontSize": 13.333333333333332,
      "labelColor": "#605E5C"
    },
    "legend": {
      "titleFont": "Segoe UI",
      "titleFontWeight": "bold",
      "titleColor": "#605E5C",
      "labelFont": "Segoe UI",
      "labelFontSize": 13.333333333333332,
      "labelColor": "#605E5C",
      "symbolType": "circle",
      "symbolSize": 75
    }
  },
  "data": {"name": "dataset"},
  "spacing": 45,
  "bounds": "flush",
  "vconcat": [
    {
      "width": 450,
      "height": 150,
      "layer": [
        {
          "mark": {
            "type": "bar",
            "tooltip": "true",
            "color": "cadetblue"
          },
          "encoding": {
            "x": {
              "bin": {"maxbins": 20},
              "field": "__1__",
              "type": "quantitative",
              "scale": {
                "domain": [0, 11000]
              },
              "title": ""
            },
            "y": {
              "aggregate": "count",
              "field": "__0__",
              "type": "quantitative",
              "axis": {"labels": false}
            }
          }
        },
        {
          "transform": [
            {
              "density": "__1__",
              "bandwidth": 0.3
            }
          ],
          "mark": {
            "type": "line",
            "color": "black",
            "strokeWidth": 2,
            "opacity": 0.6
          },
          "encoding": {
            "x": {
              "field": "value",
              "axis": true,
              "type": "quantitative",
              "scale": {
                "domain": [0, 11000]
              }
            },
            "y": {
              "field": "density",
              "type": "quantitative",
              "axis": {"labels": false}
            }
          }
        }
      ],
      "resolve": {
        "scale": {"y": "independent"}
      }
    },
    {
      "spacing": 50,
      "bounds": "flush",
      "hconcat": [
        {
          "width": 450,
          "height": 250,
          "layer": [
            {
              "mark": "rect",
              "encoding": {
                "x": {
                  "bin": {
                    "maxbins": 20
                  },
                  "field": "__1__",
                  "title": "__1__"
                },
                "y": {
                  "bin": {
                    "maxbins": 20
                  },
                  "field": "__0__",
                  "title": "Rating"
                },
                "color": {
                  "aggregate": "count",
                  "scale": {
                    "scheme": "lighttealblue"
                  },
                  "legend": {
                    "direction": "horizontal",
                    "gradientLength": 120,
                    "orient": "none",
                    "legendX": 500,
                    "legendY": 10
                  }
                }
              }
            },
            {
              "mark": {
                "type": "point",
                "tooltip": true,
                "color": "black",
                "size": 3
              },
              "encoding": {
                "x": {
                  "field": "__1__",
                  "type": "quantitative",
                  "scale": {
                    "domain": [0, 11000]
                  }
                },
                "y": {
                  "field": "__0__",
                  "type": "quantitative",
                  "scale": {
                    "domain": [6, 10]
                  }
                },
                "xOffset": {
                  "field": "__2__"
                }
              }
            },
            {
              "mark": {
                "type": "line",
                "color": "firebrick",
                "strokeWidth": 1,
                "strokeDash": [1, 2]
              },
              "transform": [
                {
                  "regression": "__0__",
                  "on": "__1__",
                  "method": "linear",
                  "extent": [0, 10000]
                }
              ],
              "encoding": {
                "x": {
                  "field": "__1__",
                  "type": "quantitative"
                },
                "y": {
                  "field": "__0__",
                  "type": "quantitative"
                }
              }
            },
            {
              "transform": [
                {
                  "regression": "__0__",
                  "on": "__1__",
                  "method": "linear",
                  "extent": [0, 10000],
                  "params": true
                },
                {
                  "calculate": "'R²: '+format(datum.rSquared, '.2f')",
                  "as": "R2"
                }
              ],
              "mark": {
                "type": "text",
                "color": "firebrick",
                "x": "width",
                "align": "right",
                "y": -5
              },
              "encoding": {
                "text": {
                  "type": "nominal",
                  "field": "R2"
                }
              }
            }
          ]
        },
        {
          "width": 150,
          "height": 250,
          "layer": [
            {
              "mark": {
                "type": "bar",
                "color": "cadetblue",
                "tooltip": "true"
              },
              "encoding": {
                "y": {
                  "bin": {
                    "maxbins": 20
                  },
                  "field": "__0__",
                  "type": "quantitative",
                  "scale": {
                    "domain": [6, 10]
                  },
                  "title": ""
                },
                "x": {
                  "aggregate": "count",
                  "field": "__1__",
                  "type": "quantitative",
                  "axis": {
                    "labels": false
                  }
                }
              }
            },
            {
              "transform": [
                {
                  "density": "__0__",
                  "bandwidth": 0.3
                }
              ],
              "mark": {
                "type": "line",
                "orient": "horizontal",
                "color": "black",
                "strokeWidth": 2,
                "opacity": 0.6
              },
              "encoding": {
                "y": {
                  "field": "value",
                  "axis": true,
                  "type": "quantitative",
                  "scale": {
                    "domain": [6, 10]
                  }
                },
                "x": {
                  "field": "density",
                  "type": "quantitative",
                  "axis": {
                    "labels": false
                  }
                }
              }
            }
          ],
          "resolve": {
            "scale": {
              "x": "independent"
            }
          }
        }
      ]
    }
  ]
}


Hi Kerry,
Is it possible to get a link to the dataset you used to create this visual?
Or at least a screenshot of the columns/data used so I can try and replicate your example. Thanks.