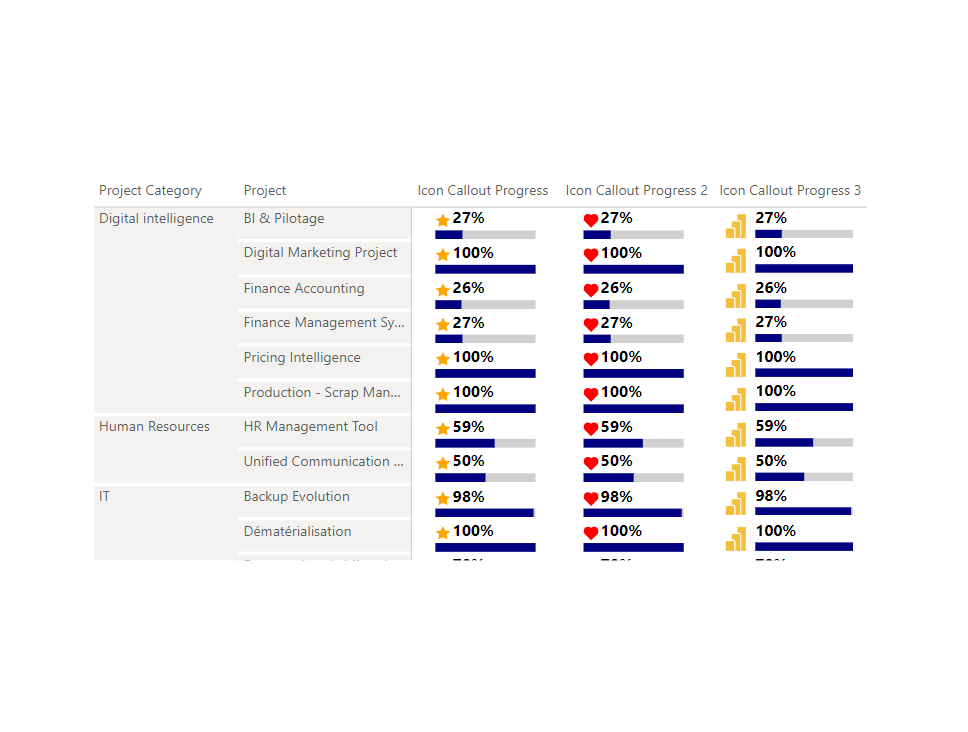
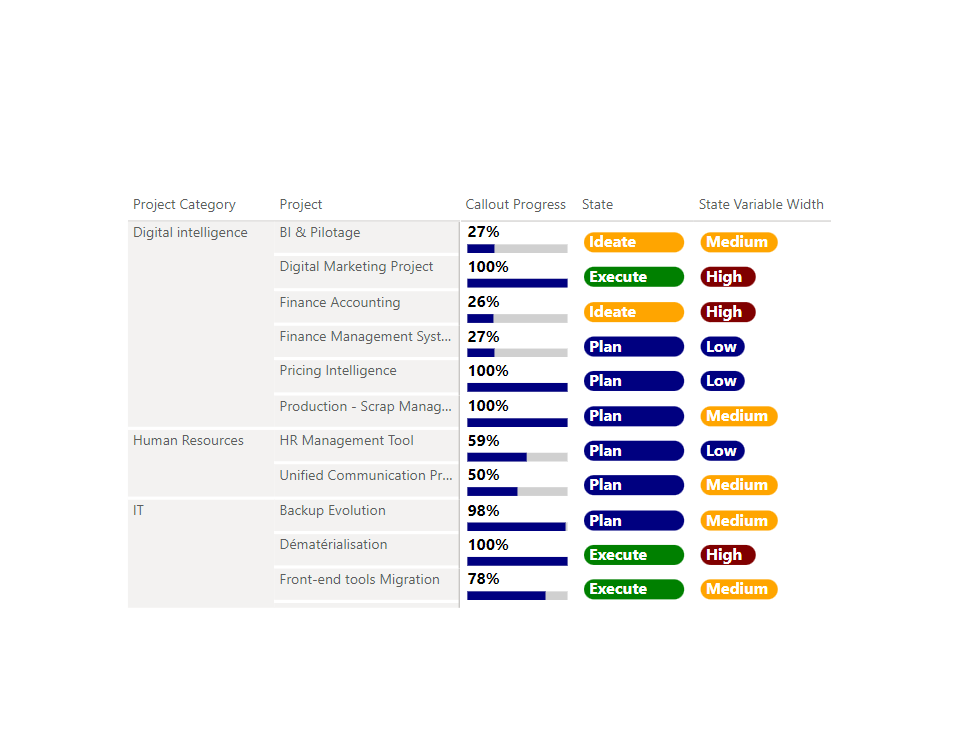
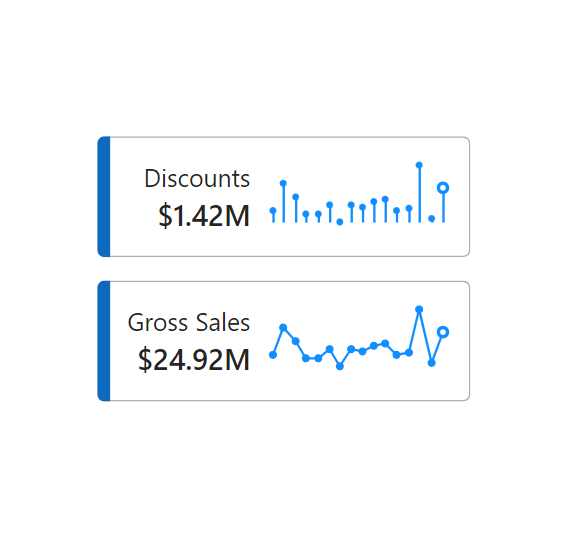
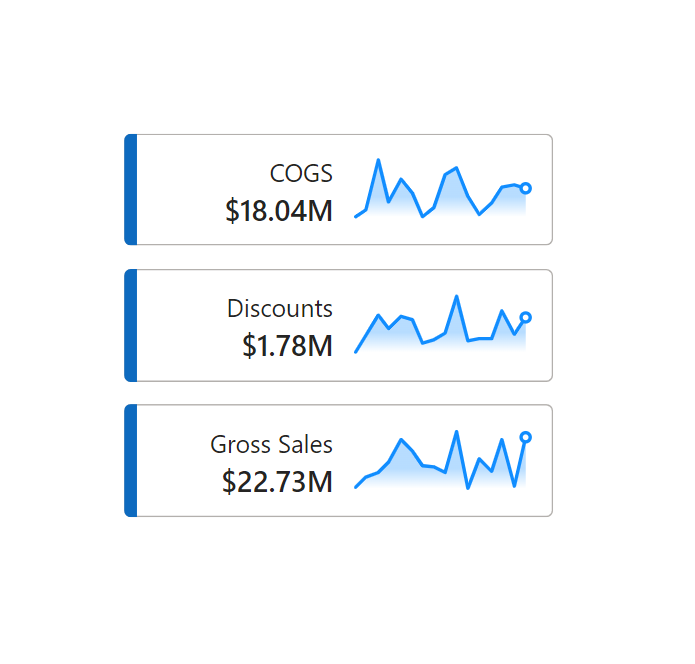
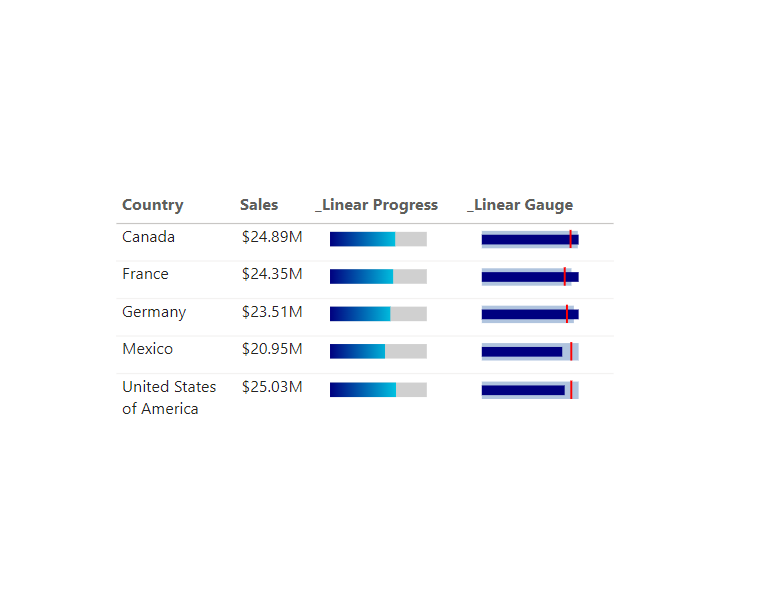
Portfolio Category: SVG Templates Templates for various Power BI custom visuals including Deneb and PlotlyJS. Learn how to import a template here. More templates and .pbix files here. All Deneb Templates PlotlyJS SVG Templates SVG Templates Radial Plot Backgrounds SVG Templates Progress with Icons SVG Templates Progress Callout SVG Templates Lollipop Sparkline SVG Templates Gradient Area Sparkline with last point SVG Templates Progress Bars Load More Loading More… You’ve reached the end of the list