
When building a Deneb custom visual for a client I came across a scenario whereby the currency within the visual showed dollars in Bing browsers but British pounds in other browsers, despite the core visuals displaying dollars across all browsers.
Thanks to a little help from DMP, this was resolved by using pbiFormat and manually specifying a locale in the options parameter
              "text": {
                "field": "value",
                "aggregate": "sum",
                "type": "quantitative",
                "format" : "$##0,.0k'",
                "formatType" : "pbiFormat",
                "options" : {"cultureSelector": "en-US"}
              }
I also needed to add additional values to the tooltips, which can be done in the encoding block of the Mark.
Each tooltip line can have a different display name and format.
"encoding: {
   "tooltip": [
              {
                "field": "cat",
                "type": "nominal",
                "title": "Category"
              },
              {
                "field": "value",
                "type": "quantitative",
                "title": "Value",
                "format": ".3f"
              },
              {
                "field": "Date",
                "type": "temporal",
                "timeUnit" : "yearmonth",
                "title": "Event",
                "format": "%B of %Y"
              }
            ]
}
Here shows an example of a default tooltip enabled within Deneb
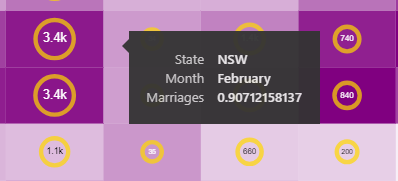
"mark": {
        "type": "rect",
        "tooltip": true
      },
And here shows a formatted tooltip
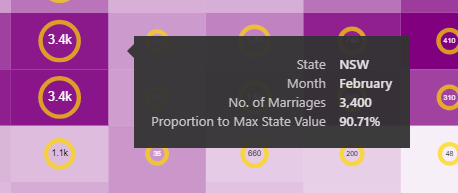
"mark": {
        "type": "rect",
        "tooltip": true
      },
"encoding": {
        "tooltip": [
              {
                "field": "State",
                "type": "ordinal",
                "title": "State"
              },
              {
                "field": "Month",
                "type": "ordinal",
                "title": "Month"
              },
              {
                "field": "Value",
                "type": "quantitative",
                "title": "No. of Marriages",
                "format": ",.2r"
              },
              {
                "field": "State Value",
                "type": "quantitative",
                "title": "Proportion to Max State Value",
                "format": ".2%"
              }
            ],
...
}
More formatting options can be found here:
Hello, Kerry,
I’m new to Deneb and I have a question that I don’t know how to solve.
I have a line chart made up of 2 layers.
The first layer shows the evolution of the market index.
The second layer shows the evolution of the price of one or more stocks that I select in a slicer.
Objective: to create a single tooltip that shows something like:
Date: 2024/01/01
Index: 1500
IBM: 120.34
AAPL: 500.55
MSFT: 320.55
This is if I had selected IBM, AAPL and MSFT.
If I had selected more or fewer companies, I would have had to show the value of each of the selected companies.
Could you help me on this?
Thank you so much.
Joao Monteiro
Thank you Kerry. This just solved the exactly problem I was currently facing