A no-code wizard for common statistical analyses. Common statistical analyses such as Multiple Linear Regression, Factor Analysis, ANOVAs, MANOVAs, and the like are hard to perform in Power BI. At…
Month: April 2021
A cheat’s guide to Power BI report design
Quick Power BI report design using PowerPoint. How I create a custom Colour Palette and Theme in 5 easy steps. When designing reports I look to an organisation’s style guide…
Just because you can…
I’d seen a number of blogs of late using the phrase “Just because you can doesn’t mean you should”. I don’t think I’ll ever get to the bottom of where…
Taking PureViz for a spin
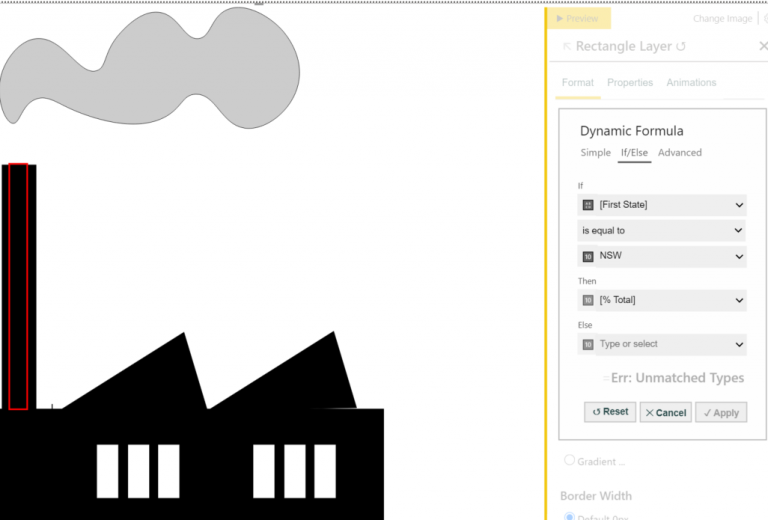
I came across PureViz in my LinkedIn feed a week or two ago. It immediately caught my attention because lo and behold, there was a rotating turbine 🙂 “Ooh is…


