
A no-code wizard for common statistical analyses.
Common statistical analyses such as Multiple Linear Regression, Factor Analysis, ANOVAs, MANOVAs, and the like are hard to perform in Power BI. At least, I haven’t come across a good instruction manual.
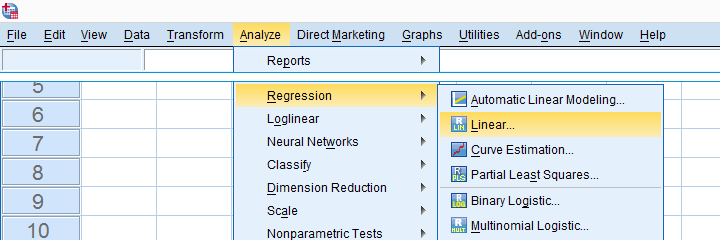
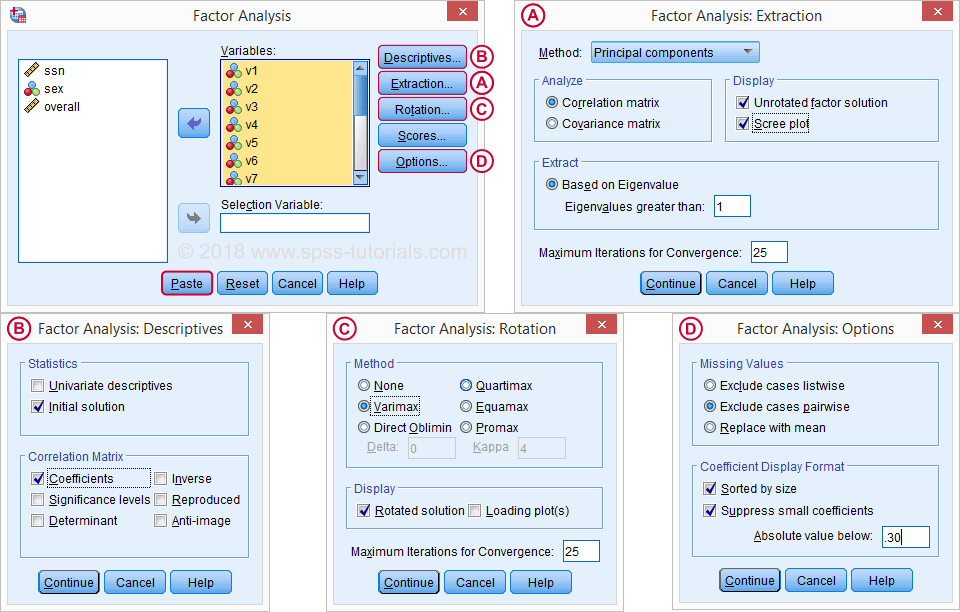
Professional researchers and statisticians use tools like IBMs SPSS – a powerful statistical package with a good, if somewhat outdated, GUI. Many have taken up R/Python – where there is little in the way of GUIs and thus these researchers have familiarised themselves with IDEs. For others, it might be down to Excel Statistical Plug-Ins, though these have never been thought of as ideal.
I know of people balancing SPSS and Power BI in their organisations that would love to be able to transition to a more integrated suite of products. For me, neither R nor SPSS are accessible. Due in part to a lack of resources, due also to a lack of inclination to learn yet another technical language.
Though I am not a professional statistician, I would love the flexibility, to on occasion, perform such analyses quickly over a dataset. Just as Microsoft is focussing on bringing AI and ML to business analysts via Power BI, would it serve to do the same with statistics for the casual market researchers and social scientists?
It is important to bear in mind here that whilst AI/ML and Statistics do overlap, they serve different purposes. The key differences being that AI/ML is focused on the immediacy of results, rather than the why or how. Whereas, statistics is more hypothesis testing, inferring relationships and understanding the significance of those relationships. Each method has its own merit.
Here’s what I envision:
- Options from a drop-down:
2) A screen similar to the quick measures gallery:
3) Descriptions of what the statistical analyses do and when to use them (serving as a reminder for those casual users who are a little rusty and whose Uni degrees were some time ago…)
4) Table outputs… a graph or two…
I muse…