Skip to content
EXPLORATIONS IN DATA STORYTELLING WITH POWER BI

EXPLORATIONS IN DATA STORYTELLING WITH POWER BI

  • Home
  • Visualisations
  • Templates
    • Deneb Templates
    • SVG Templates
    • PlotlyJS Templates
  • About
  • LinkedIn
  • Twitter
  • YouTube
  • Instagram

Month: January 2021

Exploring Data-Driven SVG Part 3 Polygons and Arcs

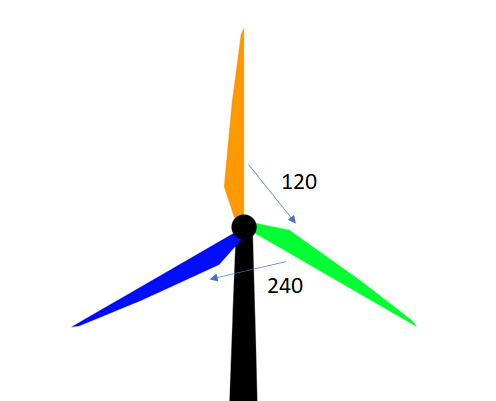
Following Data-Driven SVG Parts 1 & 2; I next explored polygon paths and arcs. The below “infographic” was an exercise in creativity and was never intended to inform. Thus, breaks…

Continue reading Exploring Data-Driven SVG Part 3 Polygons and Arcs
Published January 4, 2021
Categorized as Creative, Experimentation, HTML Content Visual, SVG

Recent Posts

  • Visualise Filters Applied
  • Custom path axis with Charticulator
  • Breaking the Rules
  • Convert to Shape
  • Quick Chart Makeover

Archives

Categories

EXPLORATIONS IN DATA STORYTELLING WITH POWER BI