
Following Data-Driven SVG Parts 1 & 2; I next explored polygon paths and arcs.
The below “infographic” was an exercise in creativity and was never intended to inform. Thus, breaks many data viz best practice rules. I suppose you could call it “data art”, though I find it lacking in artistic merit 🙂
1. Turbine Blades
The Turbine was created by drawing a series of polygon paths.
Each blade followed the following points:
--- <polygon points = xy xy xy ... /> ---
<polygon points=""111.85 139.2 107.53 139.2 99.85 113.11 104.5 58.35 109.78 14.76 111.85 10.04 111.85 129.41 111.85 139.2""</polygon>
Which I then transformed by rotating about the centre point, the first coordinate of the polygon path (111.85 139.2)
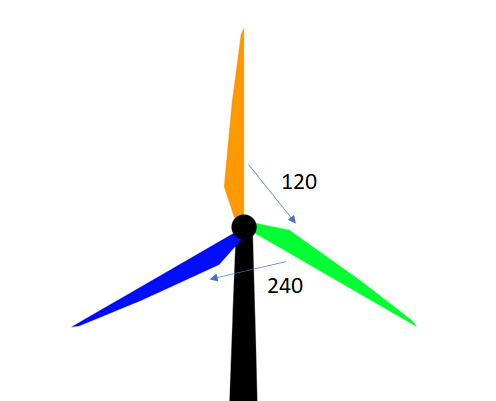
<g id=""blade1"" transform=""rotate(0,111.85 139.2)"">...</g>

<g id=""blade2"" transform=""rotate(120,111.85 139.2)"">...</g>

<g id=""blade3"" transform=""rotate(240,111.85 139.2)"">...</g>
I found the points on the left of the blade and adjusted the x coordinates using a DAX measure.
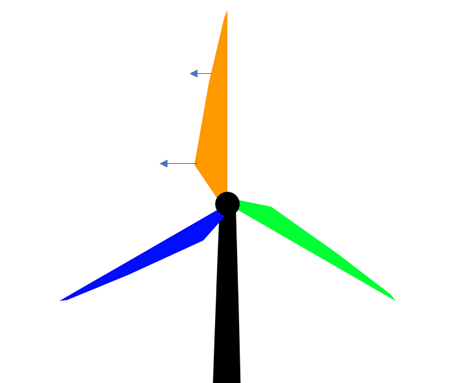
<polygon points=""111.85 139.2 107.53 139.2 "&99.85-([Scale])&" 113.11 "&104.5-([Scale]/2)&" 58.35 109.78 14.76 111.85 10.04 111.85 129.41 111.85 139.2"" style=""fill:#f90"">Finally, I tweaked the code to rotate the blades 10 degrees for each year and used the Play Axis visual to ‘play’ through the years.
<g id=""blade2"" transform=""rotate("&120+[Rotate]&",111.85 139.2)"">2. (Solar) Pie Chart
I had initially used the native pie chart for this visual, however, when I played through the years, the segments kept bouncing around and I couldn’t control the order of appearance.
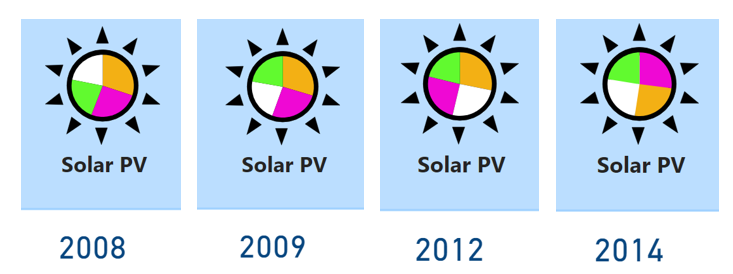
So, I thought I’d recreate this with the HTML Content Visual too – which almost broke me. My head was positively hurting trying to do the math.
I worked a solution in the end though 🙂
<g transform='rotate(-90)' >
                    <path d='M0,0 L100,0 A100,100 0 1,1 -99.71,-7.58 Z' fill=orange transform='translate(-172,169) scale(0.8,0.8)'>
                    <title>NSW: 51.2%</title></path>
                    <path d='M0,0 L-99.71,-7.58 A100,100 0 0,1 28.85,-95.74 Z' fill=magenta transform='translate(-172,169) scale(0.8,0.8)'>
                    <title>QLD: 28.4%</title></path>
                    <path d='M0,0 L28.85,-95.74 A100,100 0 0,1 75.54,-65.51 Z' fill=lime transform='translate(-172,169) scale(0.8,0.8)'>
                    <title>VIC: 9.0%</title></path>
                    <path d='M0,0 L75.54,-65.51 A100,100 0 0,1 100,0 Z' fill='white' transform='translate(-172,169) scale(0.8,0.8)'>
                    <title>Other: 11.4%</title></path>
               </g>
--- SVGPath = move-to-coordinates line-to-coordinates arc x-axis-rotation large-arc-flag sweep-flag x y // rotation = 0 ; large arc flag = if greater than 50% then 1 else 0; sweep-flag = positive angles then 1; end coordinates ---
VAR NSW = CALCULATE([% Total],CombinedWindGeneration[State]="NSW")
VAR QLD = CALCULATE([% Total],CombinedWindGeneration[State]="QLD")
...
VAR NSWAngle = (2*PI())*NSW
VAR QLDAngle = (2*PI())*(NSW+QLD)
...
--- a = 2(pie) x amount/grandtotal ; x = cos(a) *100; y = sin(a) *100 ---
VAR NSWendcoordinates = COS(NSWAngle)*100 & "," & SIN(NSWAngle)*100
VAR QLDendcoordinates = COS(QLDAngle)*100 & "," & SIN(QLDAngle)*100
...
<svg>
<defs>"& urlvicfill & urlqldfill &"</defs>
<g transform='rotate(-90)' >
<path d='M0,0 L100,0 A100,100 0 "& IF(NSW>.5,1,0) &",1 "& NSWendcoordinates &" Z' fill="& NSWFILL &" transform='translate(-172,169) scale(0.8,0.8)'>
<title>NSW: "& FORMAT(NSW,"#.0%") &"</title></path>
<path d='M0,0 L"& NSWendcoordinates &" A100,100 0 "& IF(QLD>.5,1,0) &",1 "& QLDendcoordinates &" Z' fill="& QLDFILL &" transform='translate(-172,169) scale(0.8,0.8)'>
<title>QLD: "& FORMAT(QLD,"#.0%") &"</title></path>
<path d='M0,0 L"& QLDendcoordinates &" A100,100 0 "& IF(VIC>.5,1,0) &",1 "& VICendcoordinates &" Z' fill="& VICFILL &" transform='translate(-172,169) scale(0.8,0.8)'>
<title>VIC: "& FORMAT(VIC,"#.0%") &"</title></path>
<path d='M0,0 L"& VICendcoordinates &" A100,100 0 "& IF(OTH>.5,1,0) &",1 100,0 Z' fill='white' transform='translate(-172,169) scale(0.8,0.8)'>
<title>Other: "& FORMAT(1-NSW-QLD-VIC,"#.0%") &"</title></path>
</g>
</svg>
...