Skip to content
EXPLORATIONS IN DATA STORYTELLING WITH POWER BI

EXPLORATIONS IN DATA STORYTELLING WITH POWER BI

  • Home
  • Visualisations
  • Templates
    • Deneb Templates
    • SVG Templates
    • PlotlyJS Templates
  • About
  • LinkedIn
  • Twitter
  • YouTube
  • Instagram

Month: September 2022

Custom path axis with Charticulator

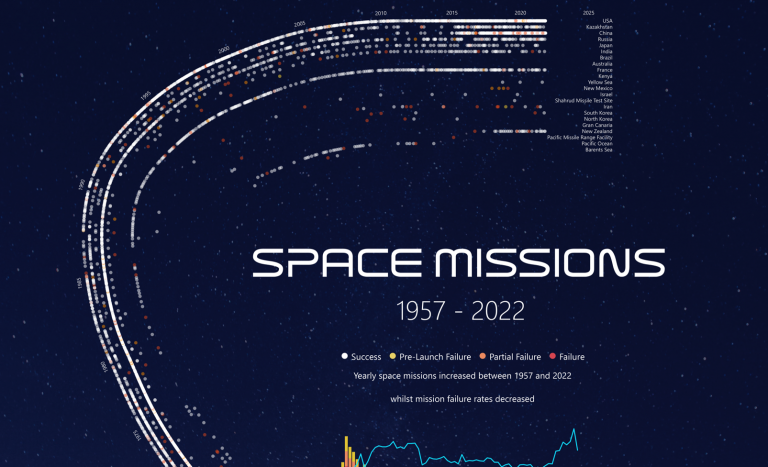
If there is one stand-out feature of Charticulator… …it is the ease at which we can design data visualisations along custom path axes. If you’re into the technical details, there…

Continue reading Custom path axis with Charticulator
Published September 29, 2022
Categorized as Charticulator, How To's

Breaking the Rules

My latest Deneb creation breaks ALL THE RULES of Dataviz But. I like it! This is a visual I designed for myself. I’m fascinated with the human body and the…

Continue reading Breaking the Rules
Published September 29, 2022
Categorized as Deneb, Experimentation, Infographic

Convert to Shape

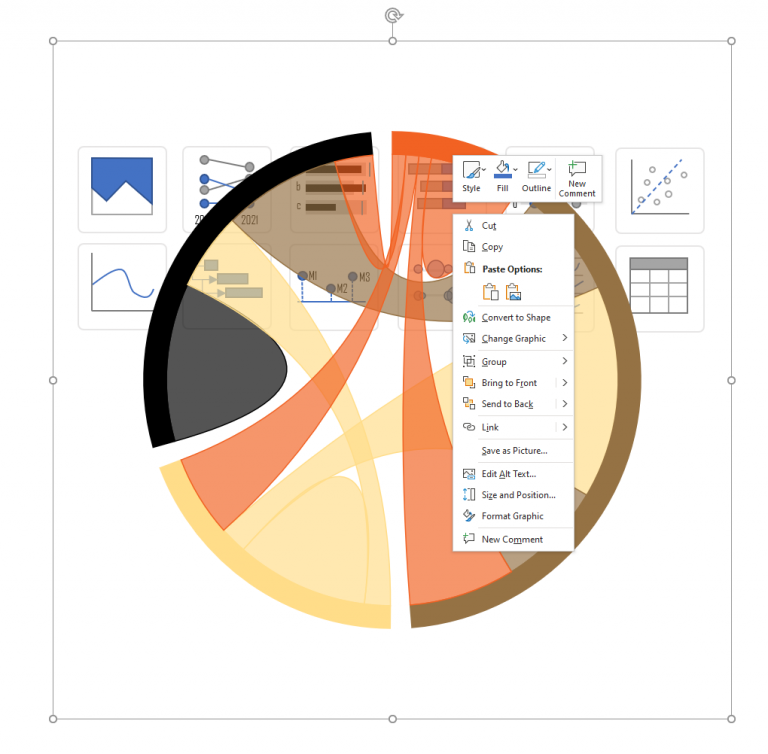
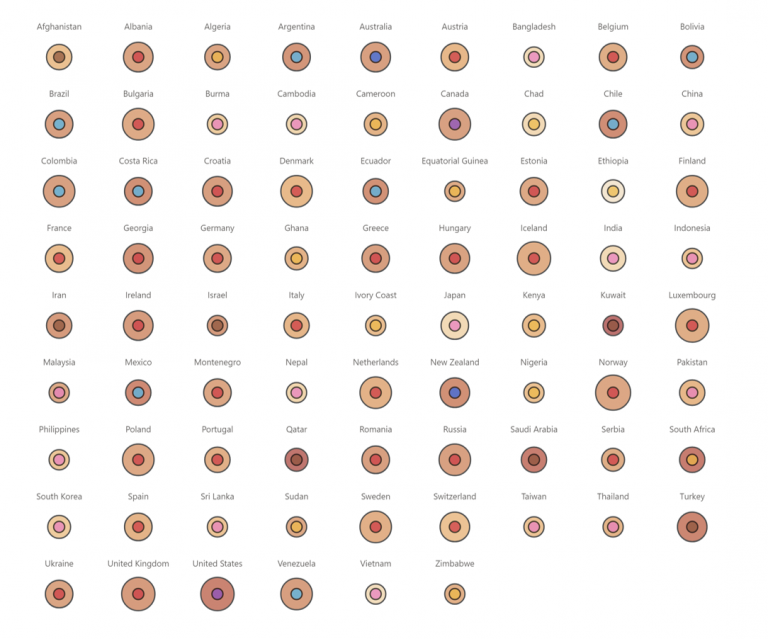
A PowerPoint Quick Trick I found myself needing to create some chart icons this week and I was without my trusty Adobe Illustrator. I instead brought out PowerPoint and began…

Continue reading Convert to Shape
Published September 15, 2022
Categorized as How To's

Quick Chart Makeover

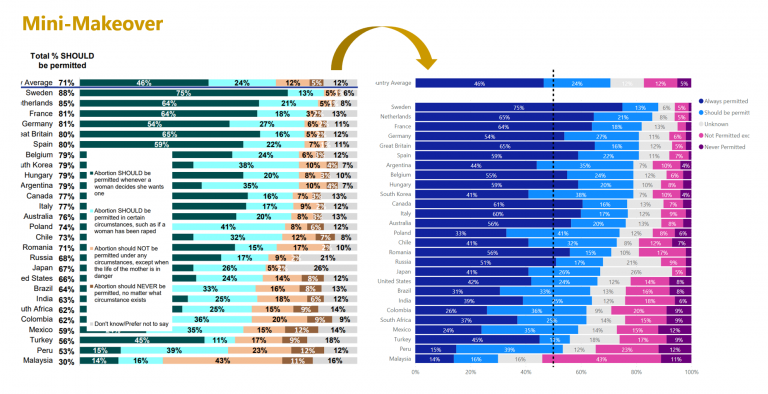
I came across this Global Views on Abortion Report which showed the following graph: It was great to compare support for permitting abortion across different countries, but it was a…

Continue reading Quick Chart Makeover
Published September 14, 2022
Categorized as How To's

Reversed Deviation Icicle Chart

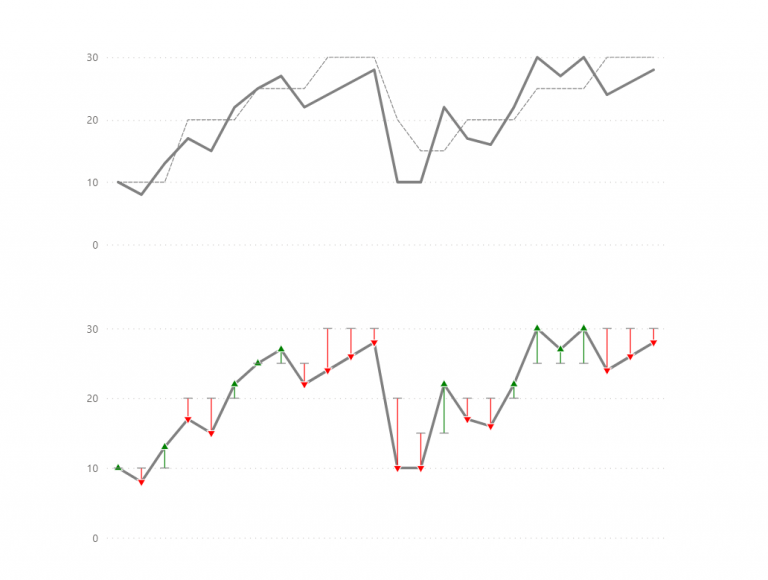
A deviation icicle chart is an uncommon chart to show variance from a target or baseline value across time. There are a multitude of ways to show comparison to target…

Continue reading Reversed Deviation Icicle Chart
Published September 5, 2022
Categorized as Custom Visualisations, Deneb, Experimentation

Recent Posts

  • Visualise Filters Applied
  • Custom path axis with Charticulator
  • Breaking the Rules
  • Convert to Shape
  • Quick Chart Makeover

Archives

Categories

EXPLORATIONS IN DATA STORYTELLING WITH POWER BI