Skip to content
EXPLORATIONS IN DATA STORYTELLING WITH POWER BI

EXPLORATIONS IN DATA STORYTELLING WITH POWER BI

  • Home
  • Visualisations
  • Templates
    • Deneb Templates
    • SVG Templates
    • PlotlyJS Templates
  • Services
    • Consultancy & Training
    • Shop Swag
  • About
  • LinkedIn
  • Bluesky
  • YouTube
  • Instagram

Category: Charticulator

Custom path axis with Charticulator

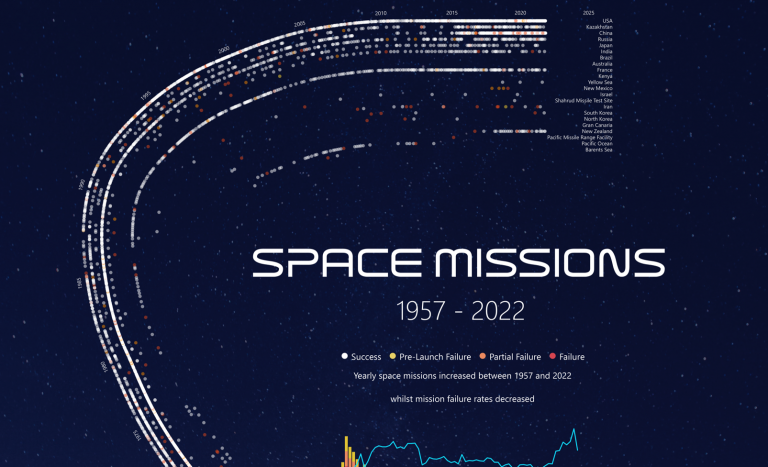
If there is one stand-out feature of Charticulator… …it is the ease at which we can design data visualisations along custom path axes. If you’re into the technical details, there…

Continue reading Custom path axis with Charticulator
Published September 29, 2022
Categorized as Charticulator, How To's

Experiences with Charticulator

My experiments with Charticulator have never been particularly fruitful. It’s come a long way since I’ve first started using it, with drill-through capability available for pbiviz exports coming in handy…

Continue reading Experiences with Charticulator
Published February 28, 2021
Categorized as Charticulator

Recent Posts

  • A matter of scatter
  • Smoothed Line Faux-Pax’s (and Other Things UI/UX Can’t Teach You About Data Visualisation)
  • Upcoming Workshops
  • Cool report design tips with the updated Image visual
  • Protected: Make your blogs stand-out from the crowd

Archives

Categories

Meta

  • Log in
  • Entries feed
  • Comments feed
  • WordPress.org
EXPLORATIONS IN DATA STORYTELLING WITH POWER BI