
November 2025 Power BI update brings new settings for the image visual.
Previously, selecting the image visual opened up file explorer to drop a PNG or JPEG on the report canvas. To add SVG images we needed to use a button.
In this new update, there are now settings to add image via upload, data, or URL – pretty darn neat – opening up an array of creative opportunities for dynamic images.
From URL
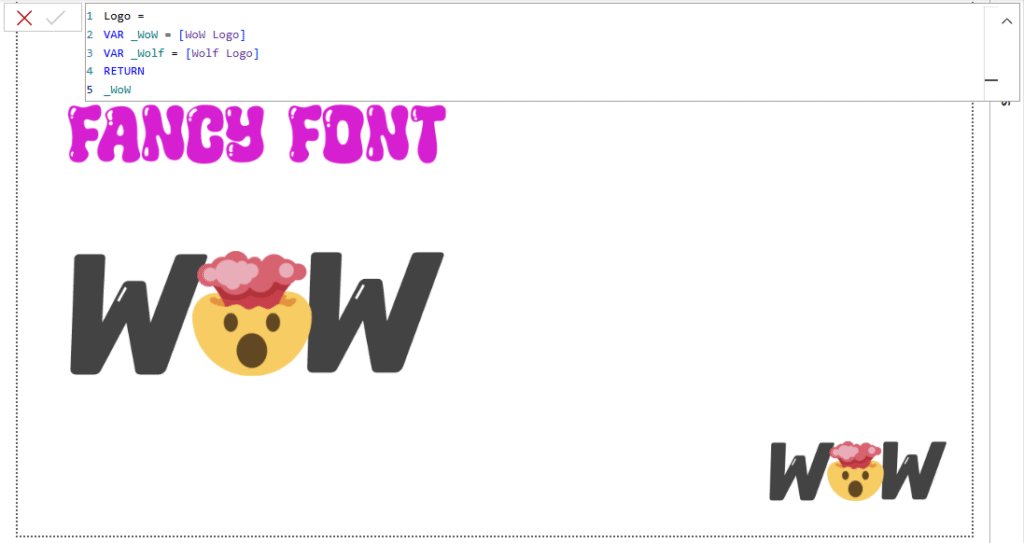
To demonstrate the use of image from URL we can head on over to font space and pick some fancy lettering
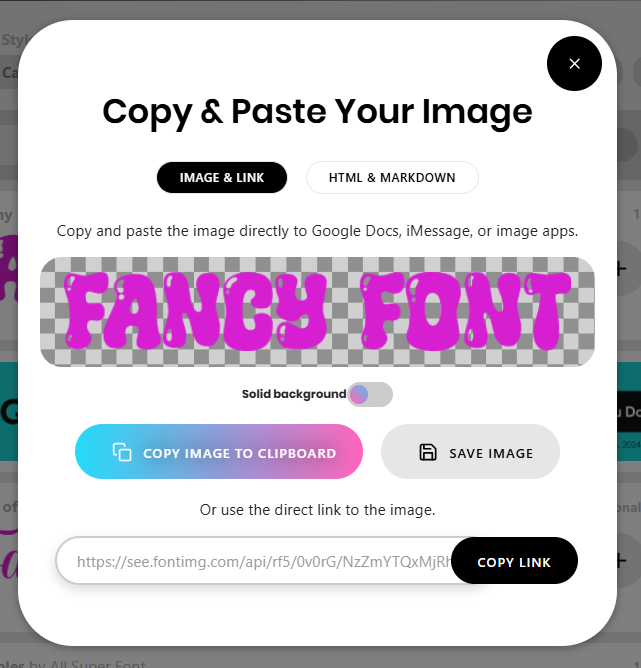
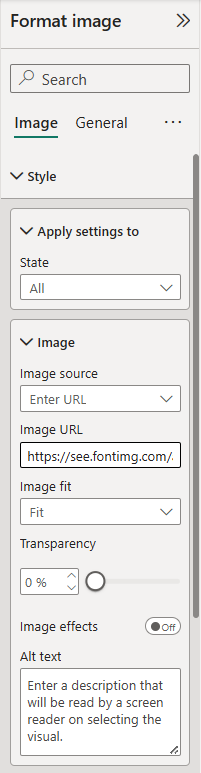
copy the link to the image and paste directly into the formatting options to view on the canvas
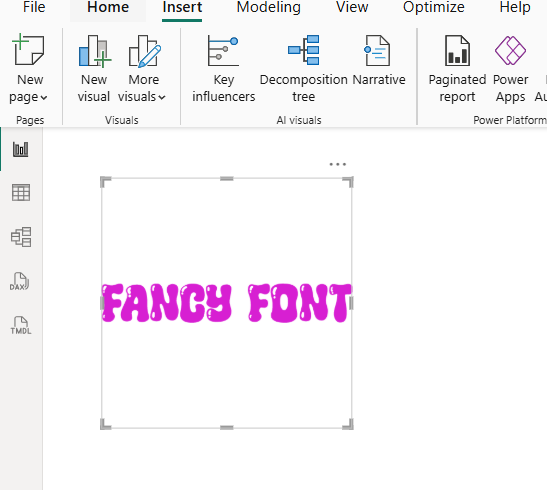
Don’t like the font? We can quickly swap it out by changing the URL
From Data
Adding images from data opens up the opportunity to add customised SVGs to the canvas and also the ability to templatize reports. Need to change company logos on numerous and various reports? Using a measure as the image source can simplify that process.
The company logo could be captured in a measure as Base64, SVG, or URL, and simply changing that one measure, will change all image visuals using that measure. Neat huh?
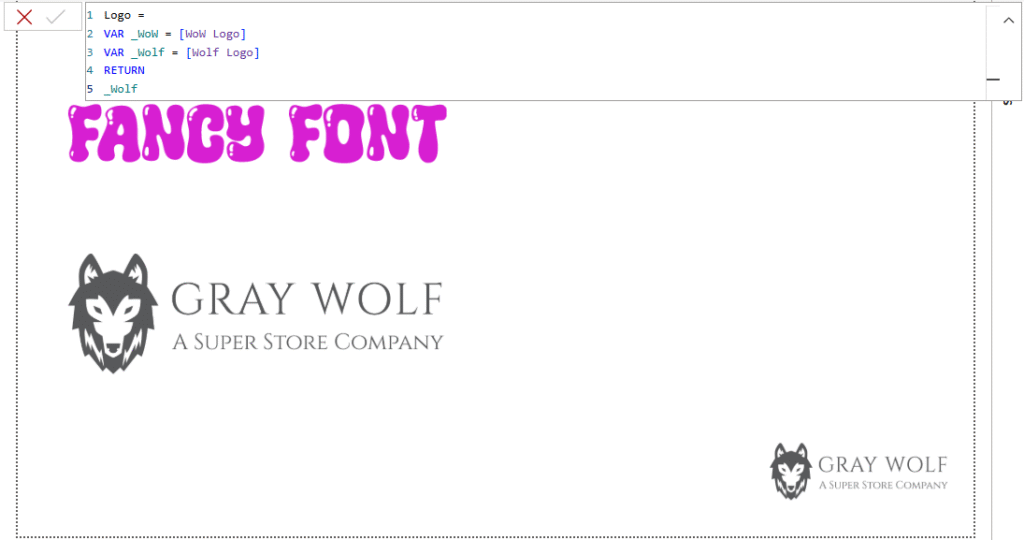
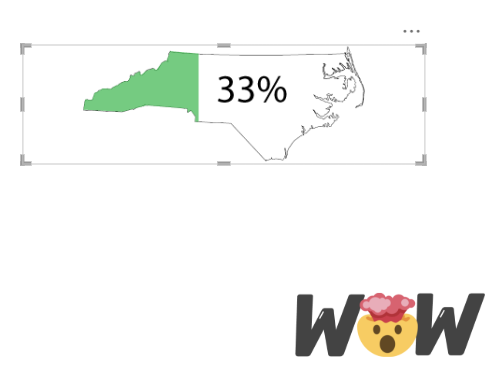
Having a single visual to display SVGs like pictograms is useful, being simpler than hacking the formatting for the table and card visuals to hide headers and borders.
Actions and States
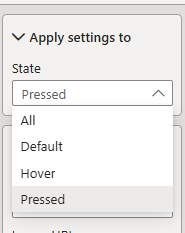
The image visual now has actions and states similar to buttons, allowing developers to change image types, opacity, backgrounds and elements upon hover and selection.


Gifs can be utilised in reports and designed with “on / off” switches – something that was difficult to achieve with other core visuals.
On UDFs
The image visual is now a lot more versatile and whilst UDFs are in preview, there’s a lot to explore. Particularly with regard to templating buttons and images.
Happy Vizin’
Kez