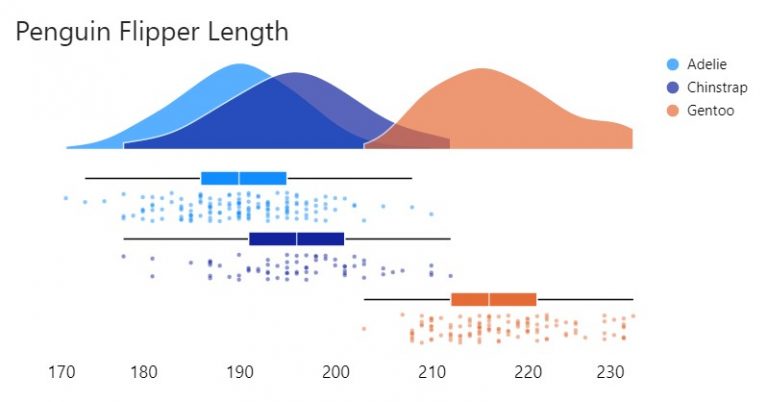
Raincloud plots are a relatively recent and effective addition to the data visualisation toolkit comprising three parts: 1) distributions as density (half-violin plot); 2) summary statistics (box plot) and 3)…

Raincloud plots are a relatively recent and effective addition to the data visualisation toolkit comprising three parts: 1) distributions as density (half-violin plot); 2) summary statistics (box plot) and 3)…