Skip to content
EXPLORATIONS IN DATA STORYTELLING WITH POWER BI

EXPLORATIONS IN DATA STORYTELLING WITH POWER BI

  • Home
  • Visualisations
  • Templates
    • Deneb Templates
    • SVG Templates
    • PlotlyJS Templates
  • About
  • LinkedIn
  • Twitter
  • YouTube
  • Instagram

Month: October 2021

KPI Cards with Core Matrix Visual

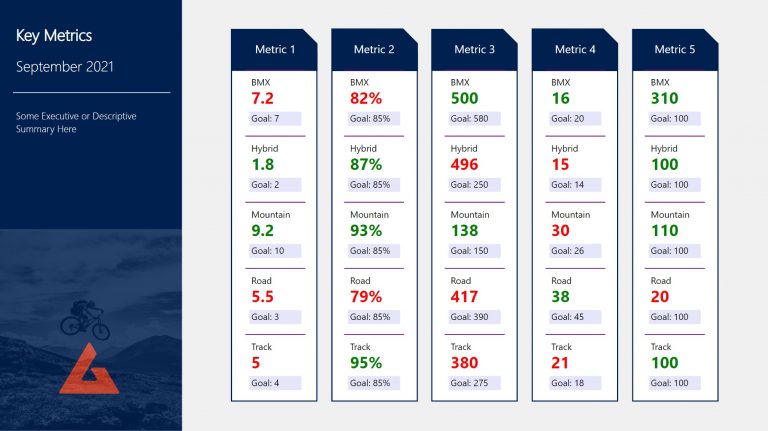
I came across a Power BI report in development that had 127 visuals (with 107 of them being KPI Cards) on a page. It took a while to load (between…

Continue reading KPI Cards with Core Matrix Visual
Published October 3, 2021
Categorized as Power BI, SVG

Slope Graph with Core Visuals

How I created a slope graph with Power BI Core Visuals. Many people have demonstrated how to create a slope graph with Power BI Core visuals, but I was curious…

Continue reading Slope Graph with Core Visuals
Published October 2, 2021
Categorized as Power BI

Recent Posts

  • Visualise Filters Applied
  • Custom path axis with Charticulator
  • Breaking the Rules
  • Convert to Shape
  • Quick Chart Makeover

Archives

Categories

EXPLORATIONS IN DATA STORYTELLING WITH POWER BI