Skip to content
EXPLORATIONS IN DATA STORYTELLING WITH POWER BI

EXPLORATIONS IN DATA STORYTELLING WITH POWER BI

  • Home
  • Visualisations
  • Templates
    • Deneb Templates
    • SVG Templates
    • PlotlyJS Templates
  • About
  • LinkedIn
  • Twitter
  • YouTube
  • Instagram

Month: September 2021

Line interpolation

Slope Graphs

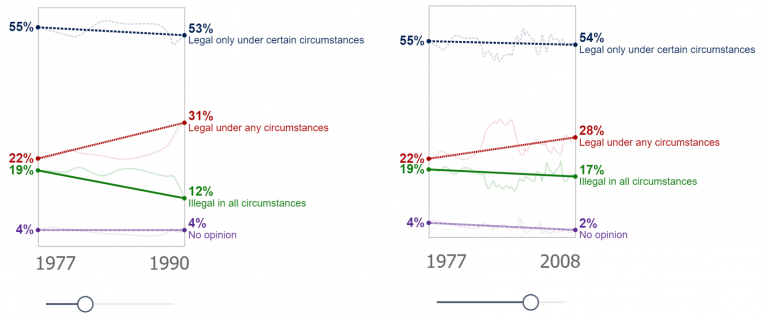
Makeover Monday again! and this time I’m creating a slope graph. Yes, I could achieve this with the core visualisation, but I wouldn’t have as much control as I desired…

Continue reading Line interpolation
Published September 12, 2021
Categorized as Custom Visualisations, Deneb, Vega-Lite

Exploring diversity

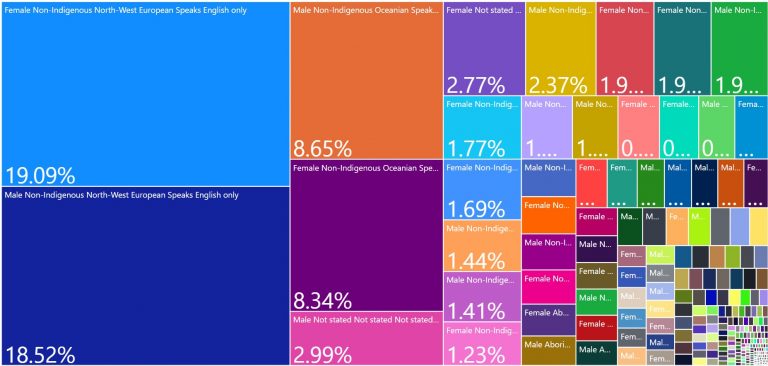
In recent days I received an email about a development program with sponsorship available for individuals who identify as being from a diverse background. This was followed by a long…

Continue reading Exploring diversity
Published September 6, 2021
Categorized as Musings

Recent Posts

  • Visualise Filters Applied
  • Custom path axis with Charticulator
  • Breaking the Rules
  • Convert to Shape
  • Quick Chart Makeover

Archives

Categories

EXPLORATIONS IN DATA STORYTELLING WITH POWER BI