Skip to content
EXPLORATIONS IN DATA STORYTELLING WITH POWER BI

EXPLORATIONS IN DATA STORYTELLING WITH POWER BI

  • Home
  • Visualisations
  • Templates
    • Deneb Templates
    • SVG Templates
    • PlotlyJS Templates
  • About
  • LinkedIn
  • Twitter
  • YouTube
  • Instagram

Month: March 2022

Thinking about target bands

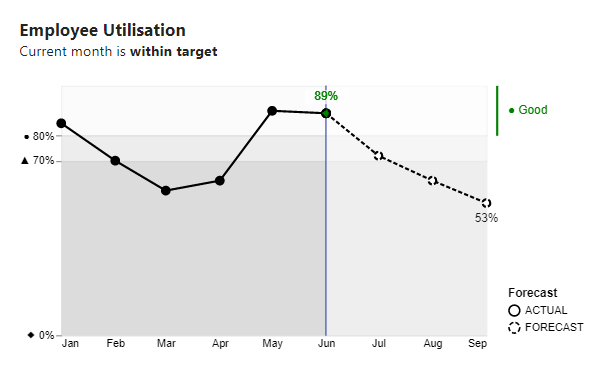
I’ve come across many charts like this in the wild. This one depicts utilisation and RAG status by month. They’re not bad charts, they serve a purpose, but they could…

Continue reading Thinking about target bands
Published March 4, 2022
Categorized as DataViz, Deneb, Experimentation

Community Heroes

Personal reflections.

Published March 3, 2022
Categorized as Uncategorized

Recent Posts

  • Visualise Filters Applied
  • Custom path axis with Charticulator
  • Breaking the Rules
  • Convert to Shape
  • Quick Chart Makeover

Archives

Categories

EXPLORATIONS IN DATA STORYTELLING WITH POWER BI