Skip to content
EXPLORATIONS IN DATA STORYTELLING WITH POWER BI

EXPLORATIONS IN DATA STORYTELLING WITH POWER BI

  • Home
  • Visualisations
  • Templates
    • Deneb Templates
    • SVG Templates
    • PlotlyJS Templates
  • About
  • LinkedIn
  • Twitter
  • YouTube
  • Instagram

Month: February 2021

Experiences with Charticulator

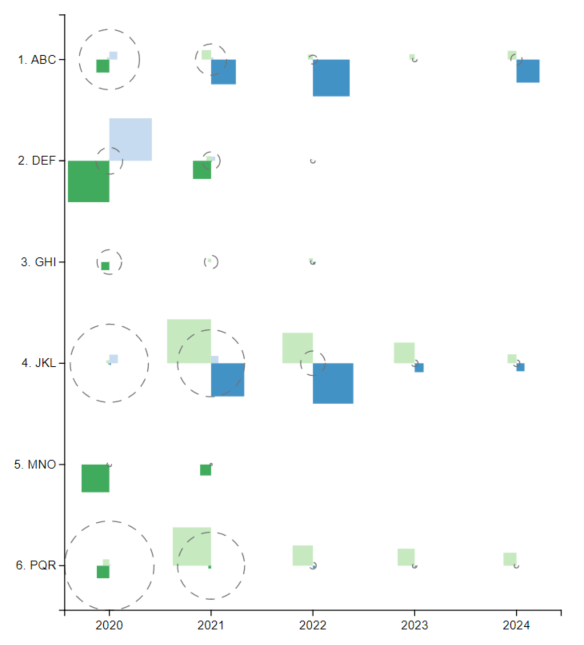
My experiments with Charticulator have never been particularly fruitful. It’s come a long way since I’ve first started using it, with drill-through capability available for pbiviz exports coming in handy…

Continue reading Experiences with Charticulator
Published February 28, 2021
Categorized as Charticulator

Exploring Data-Driven SVG Part 4 Animation and Filters

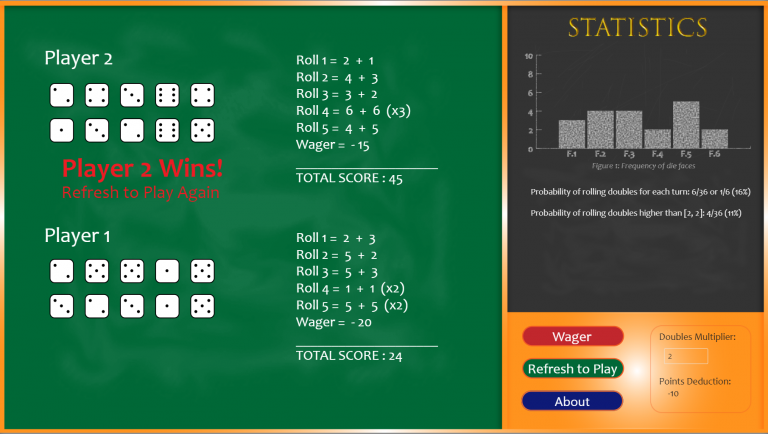
After exploring SVG size, colour fill, pattern fill, rotation, polygon paths and arcs, the next natural progression was to explore filters and animation. There are a few methods to animating…

Continue reading Exploring Data-Driven SVG Part 4 Animation and Filters
Published February 26, 2021
Categorized as Creative, Experimentation, HTML Content Visual, SVG

Recent Posts

  • Visualise Filters Applied
  • Custom path axis with Charticulator
  • Breaking the Rules
  • Convert to Shape
  • Quick Chart Makeover

Archives

Categories

EXPLORATIONS IN DATA STORYTELLING WITH POWER BI