Skip to content
EXPLORATIONS IN DATA STORYTELLING WITH POWER BI

EXPLORATIONS IN DATA STORYTELLING WITH POWER BI

  • Home
  • Visualisations
  • Templates
    • Deneb Templates
    • SVG Templates
    • PlotlyJS Templates
  • About
  • LinkedIn
  • Twitter
  • YouTube
  • Instagram

Month: January 2022

Legend for a layered plot in Deneb

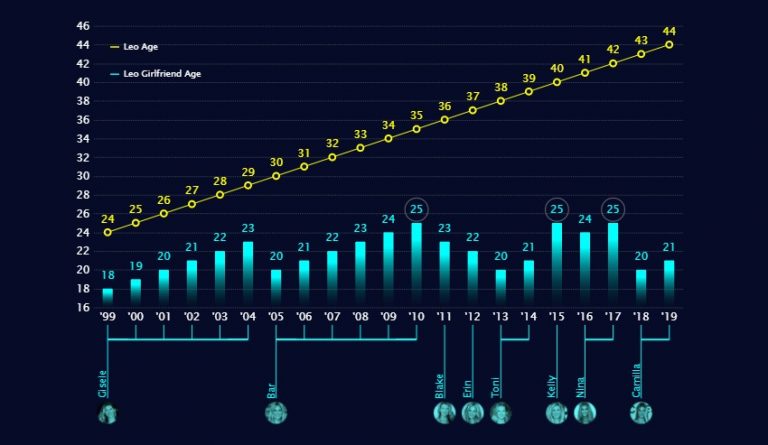
I came across this dataviz in my Twitter feed and it instantly drew my attention: My interest was in the aesthetics of the visual and not the subject matter. I…

Continue reading Legend for a layered plot in Deneb
Published January 9, 2022
Categorized as Deneb

Images and custom shapes in Deneb

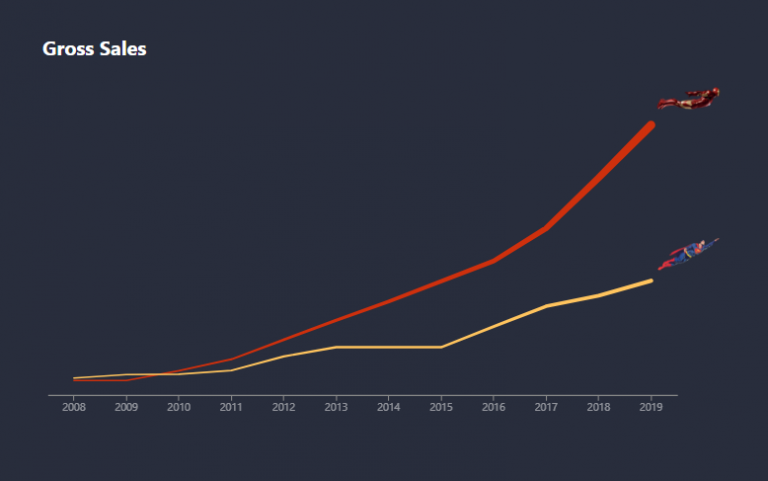
Over the past few months, I’ve had considerable fun exploring images and custom shapes with Deneb Custom visual for Power BI. I’ve finally gotten around to blogging about it. There…

Continue reading Images and custom shapes in Deneb
Published January 6, 2022
Categorized as Custom Visualisations, Deneb, Experimentation, Vega-Lite

Visualising 2021

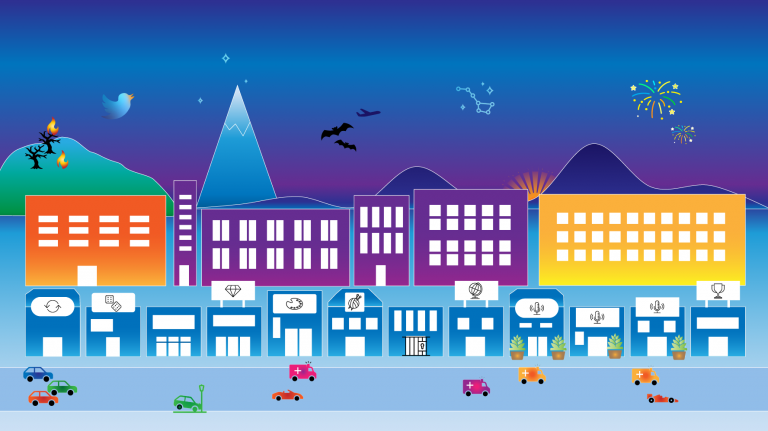
2021 was an extraordinary year for me. I’m a woman of few words, so rather than write about it, I’d thought I’d illustrate it. The below image is deeply personal,…

Continue reading Visualising 2021
Published January 2, 2022
Categorized as Musings

Recent Posts

  • Visualise Filters Applied
  • Custom path axis with Charticulator
  • Breaking the Rules
  • Convert to Shape
  • Quick Chart Makeover

Archives

Categories

EXPLORATIONS IN DATA STORYTELLING WITH POWER BI