
2021 was an extraordinary year for me.
I’m a woman of few words, so rather than write about it, I’d thought I’d illustrate it.
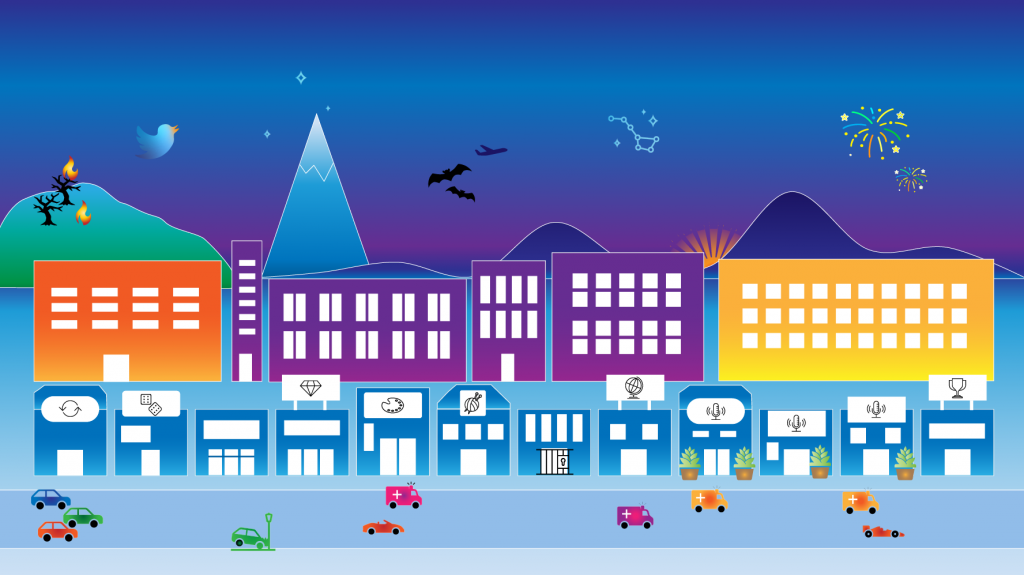
The below image is deeply personal, so I shan’t explain it all.
Those that have seen my crafts, will know that I lack in artistic ability. I try to shake my pessimism, by telling myself this illustration is about symbolism more than it is about art, but I’m still a little begrudging.
This illustration contains some DataViz – the dark blue hillscape was created in RAWGraphs and represents my blog views throughout the year. The peaks highlight the blogs I shared on social media – most of my blogs I posted quietly.
The coloured “skyscrapers” represent my places of employment and length of assignments.
The smaller shopfronts represent achievements each month, the windows and doors are counts of vizzes and blog articles posted.
The building with the diamond atop represents when I published my blog site in April.
There’s more hidden in there if you know what you are looking for 🙂
2021 was a year of great personal and professional development.
I advanced my skills in DataViz thanks to the wonderful opportunity of being able to test drive Deneb throughout the year. I had immense fun along the way.
My blogging also aided in my DataViz knowledge. The first blog I shared (Reasons to Avoid Gradient Backgrounds) was based on foundational knowledge of visual perception and written as an introspection. Up until that time I had struggled to find detailed information on how to DataViz effectively, what I had gained was mostly through experience. But whether Google has gradually learned the articles I like to read, or that I’ve now expanded my network, DataViz science articles have become easier to find. They’ve been there all along. Most fascinating is that there is still much to learn in the discipline, many things to test, explore, and define. I’d feel immensely accomplished if in future I could help contribute and advance knowledge in this area.
Stepping out of my comfort zone was a theme for the year. The idea of sharing my work so publicly would have petrified me a year prior (it still does). I don’t quite know what came over me. It seems I’ve finally found a passion in life, and that passion outweighs any anxieties I may have.
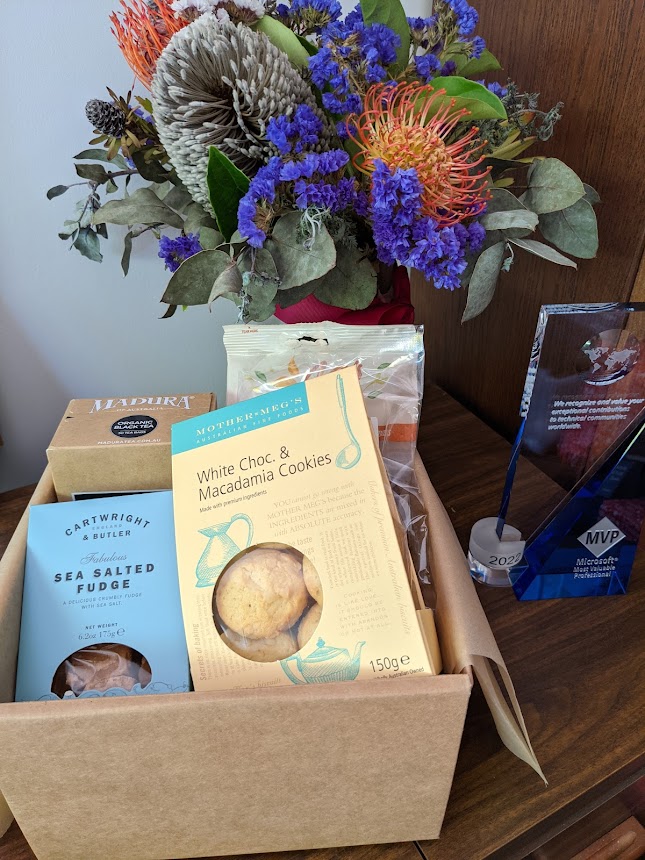
Stepping outside my comfort zone brought about many opportunities (some of which I had to forgo) all of which culminated in a Microsoft MVP award in December! Wowzer!
I’ve definitely been spoiled rotten – friends, family, employers past and present, Power BI community.
Which brings me to my goals for 2022.
2021 was jam-packed and I found myself overwhelmed at times. I’d like to keep community work steady and not detract too much from my kids and family.
I plan to continue doing what I enjoy doing. That means exploring Deneb more, and hopefully having the opportunity of doing the same with other new visuals that pop up during the year. I’d like to continue to support developers of custom visuals, by the means I have available to me.
Joining the Workout Wednesday team this year is terribly exciting. I love seeing others develop and put their own spin on DataViz. I’ll greatly enjoy contributing to this fantastic initiative.
I’ll also continue blogging as this helps distil my thoughts. If ruminating was an Olympic sport, I’m sure I’d make the podium!
A little more on the personal side….
As always I will endeavour to make time for craft projects as these keep me grounded and away from the screen.
I’ll also invest more in my physical health and fitness. I’m getting old now. It’s about bloody time I get off my arse 🙂