
I came across this dataviz in my Twitter feed and it instantly drew my attention:
My interest was in the aesthetics of the visual and not the subject matter. I became curious to see if I could recreate the style with Deneb in Power BI. After a bit of fiddling about I produced something similar:
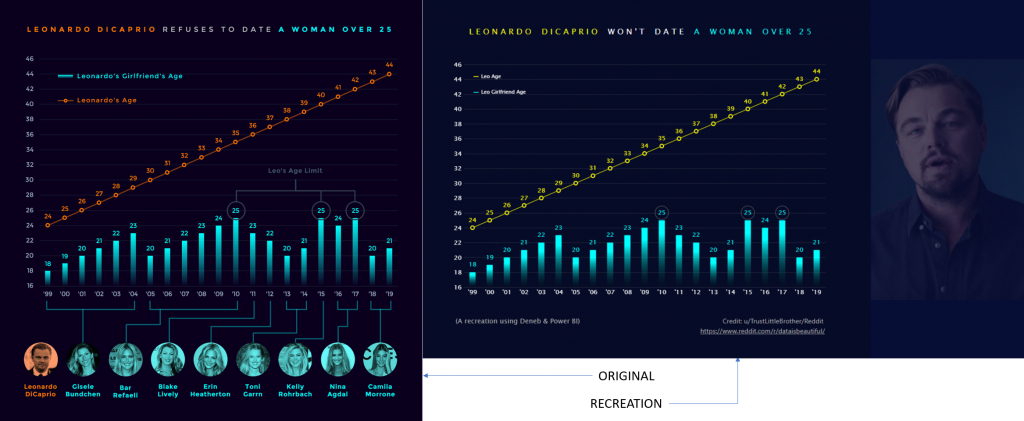
For the main chart, I created 5 layers. One each for the bar and line marks, 2 for the text labels and 1 for highlighting the maximum values.
I spent time adjusting the grid, colour, colour gradient, and sizing of each of the marks.
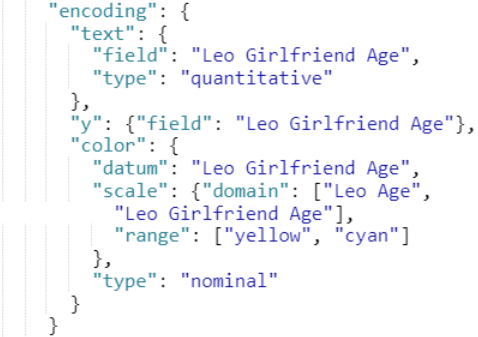
Adding the legend was tricky. With Vega-Lite the legend is automatically created when data is encoded with the colour, opacity, size and shape channels. However, in this case, colour is constant for each of the layers. If I encoded colour with “field” = “Leo Age”, then each of the age values would be a distinct colour.
To create a legend I needed to set “datum” = “Leo Age” and then set the colour scales in the colour encoding channel. I chose to do this in the text layers as wasn’t sure how to handle the gradient cyan colours.
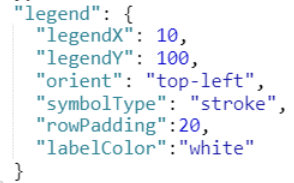
Once the legend was created I adjusted its positioning and row padding in the config section of the Deneb editor and changed the symbol from circle to a line stroke.
The next tricky part was recreating the data-driven image labels. I leveraged the original viz to create the images of the women, converted them to Base64 and added these to the Power BI dataset. I kept the images small so they rendered nicely.
I joined a second graph to the bottom of the main chart for the image labels using the vconcat function. The labels and links were dynamically positioned along the x axis by encoding “field”=”Year”, but were manually positioned along the y axis by encoding as constants (e.g. “datum”=-5).
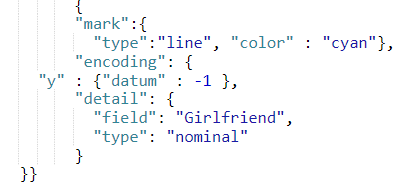
The links were created using a combination of line and rule marks. Long rule marks for the first year of a new girlfriend, short rule marks elsewhere. Connecting the short rule marks was a line. To create distinct lines for each girlfriend and maintain the same colour, I encoded detail with “field” = “Girlfriend.
JSON Template is provided below. This can be copied into Notepad, .txt changed to .json and imported into Deneb Custom Visual.
{
  "$schema": "https://vega.github.io/schema/vega-lite/v5.json",
  "usermeta": {
    "deneb": {
      "build": "1.0.0.157",
      "metaVersion": 1,
      "provider": "vegaLite"
    },
    "interactivity": {
      "tooltip": true,
      "contextMenu": true,
      "selection": false,
      "dataPointLimit": 50
    },
    "information": {
      "name": "Gradient Bar and Line Graph",
      "description": "Gradient Bar and Line Graph with text labels and highlighted maximum values for use on dark backgrounds",
      "author": "Kerry Kolosko",
      "uuid": "c573eda2-4ed2-46bd-ba52-96036a76303e",
      "generated": "2022-01-09T02:21:27.413Z"
    },
    "dataset": [
      {
        "key": "__0__",
        "name": "Year Sort",
        "description": "",
        "type": "numeric",
        "kind": "column"
      },
      {
        "key": "__1__",
        "name": "YEAR",
        "description": "",
        "type": "text",
        "kind": "column"
      },
      {
        "key": "__2__",
        "name": "Leo Girlfriend Age",
        "description": "",
        "type": "numeric",
        "kind": "measure"
      },
      {
        "key": "__3__",
        "name": "Leo Age",
        "description": "",
        "type": "numeric",
        "kind": "measure"
      },
      {
        "key": "__4__",
        "name": "MAXVALUE",
        "description": "Add a measure for highlighting the maximum values in a series",
        "type": "numeric",
        "kind": "measure"
      }
    ]
  },
  "config": {
    "autosize": {
      "type": "fit",
      "contains": "padding"
    },
    "view": {"stroke": "transparent"},
    "font": "Lucida Sans Unicode",
    "bar": {"color": "#CE6C47"},
    "axis": {
      "domain": false,
      "labelColor": "white",
      "labelFontSize": 12,
      "labelPadding": 5,
      "labelAngle": 0,
      "ticks": false,
      "tickCount": 10,
      "titleFontSize": 14,
      "titleFontWeight": "bold",
      "titleColor": "white",
      "gridDash": [1, 1],
      "gridColor": "grey",
      "gridOpacity": 0.5
    },
    "legend": {
      "legendX": 10,
      "legendY": 100,
      "orient": "top-left",
      "symbolType": "stroke",
      "rowPadding": 20,
      "labelColor": "white"
    }
  },
  "data": {"name": "dataset"},
  "encoding": {
    "x": {
      "field": "__1__",
      "sort": {
        "field": "__0__",
        "op": "sum"
      },
      "title": ""
    },
    "y": {
      "type": "quantitative",
      "scale": {"domain": [16, 46]},
      "title": ""
    }
  },
  "layer": [
    {
      "mark": {
        "type": "bar",
        "clip": true,
        "width": {"band": 0.4},
        "cornerRadius": 1,
        "color": {
          "x1": 1,
          "y1": 1.1,
          "x2": 1,
          "y2": 0,
          "gradient": "linear",
          "stops": [
            {
              "offset": 0,
              "color": "transparent"
            },
            {
              "offset": 1,
              "color": "cyan"
            }
          ]
        }
      },
      "encoding": {
        "y": {
          "aggregate": "sum",
          "field": "__2__"
        }
      }
    },
    {
      "mark": {
        "type": "line",
        "strokeWidth": 1,
        "point": {
          "color": "yellow",
          "filled": false,
          "fill": "#080F3D",
          "size": 50,
          "strokeWidth": 2
        },
        "color": "yellow",
        "tooltip": true
      },
      "encoding": {
        "y": {"field": "__3__"},
        "color": {
          "datum": "__3__",
          "scale": {
            "range": ["yellow", "cyan"]
          },
          "type": "nominal"
        }
      }
    },
    {
      "mark": {
        "type": "text",
        "align": "center",
        "yOffset": -15,
        "color": "yellow",
        "size": 12,
        "tooltip": true
      },
      "encoding": {
        "text": {
          "field": "__3__",
          "type": "quantitative"
        },
        "y": {"field": "__3__"}
      }
    },
    {
      "mark": {
        "type": "text",
        "align": "center",
        "yOffset": -15,
        "color": "cyan",
        "tooltip": true,
        "size": 12
      },
      "encoding": {
        "text": {
          "field": "__2__",
          "type": "quantitative"
        },
        "y": {"field": "__2__"},
        "color": {
          "datum": "__2__",
          "scale": {
            "domain": [
              "__3__",
              "__2__"
            ],
            "range": ["yellow", "cyan"]
          },
          "type": "nominal"
        }
      }
    },
    {
      "mark": {
        "type": "point",
        "align": "center",
        "yOffset": -15,
        "size": 700,
        "strokeWidth": 1,
        "tooltip": true
      },
      "encoding": {
        "y": {"field": "__2__"},
        "color": {
          "condition": {
            "test": "datum['__4__'] === 1",
            "value": "grey"
          },
          "value": "transparent"
        }
      }
    }
  ]
}
Alhamdulillah, Thank you so much