
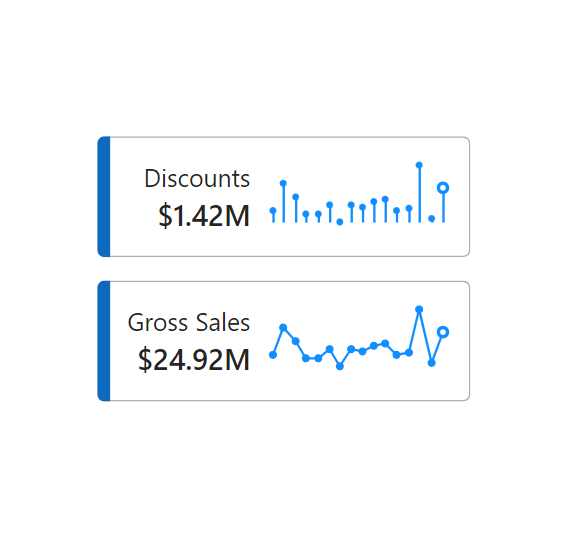
Lollipop Categorical Axis =
// Static line color - use %23 instead of # for Firefox compatibility (Measure Derived from Eldersveld Modified by Kolosko)
VAR LineColour = "%23118DFF"
VAR PointColour = "white"

// "Date" field used in this example along the X axis
VAR XMinDate = MIN(financials[Date])
VAR XMaxDate = MAX(financials[Date])

// Obtain overall min and overall max measure values when evaluated for each date
VAR YMinValue = MINX(Values(financials[Date]),CALCULATE([SUM Gross Sales]))
VAR YMaxValue = MAXX(Values(financials[Date]),CALCULATE([SUM Gross Sales]))

// Build table of X & Y coordinates and fit to 50 x 150 viewbox
VAR SparklineTable = ADDCOLUMNS(
    SUMMARIZE('financials',financials[Date]),
        "X",INT(150 * DIVIDE(financials[Date] - XMinDate, XMaxDate - XMinDate)),
        "Y",INT(50 * DIVIDE([SUM Gross Sales] - YMinValue,YMaxValue - YMinValue)))

// Concatenate X & Y coordinates to build the sparkline
VAR Lines = CONCATENATEX(SparklineTable,[X] & "," & 50-[Y]," ", financials[Date])
VAR PointTable=
    ADDCOLUMNS(
        SUMMARIZE('financials',financials[Date]),
            "@Colour",IF([SUM Gross Sales]=YMaxValue,"Green",IF([SUM Gross Sales]=YMinValue,"Red",LineColour)),
        "@Points", "<circle cx='"&INT(150 * DIVIDE(financials[Date] - XMinDate, XMaxDate - XMinDate))&"' cy='" & 50 -  INT(50 * DIVIDE([SUM Gross Sales] - YMinValue,YMaxValue - YMinValue)) & "' r='3' fill='"&LineColour&"'/>")

VAR BarTable=
    ADDCOLUMNS(
        SUMMARIZE('financials',financials[Date]),
            "@Colour",IF([SUM Gross Sales]=YMaxValue,"Green",IF([SUM Gross Sales]=YMinValue,"Red",LineColour)),
        "@Bars", "<rect x='"&INT(150 * DIVIDE(financials[Date] - XMinDate, XMaxDate - XMinDate))&"' width='1' stroke='"&LineColour&"' stroke-width='1' y='" & 50 -  INT(50 * DIVIDE([SUM Gross Sales] - YMinValue,YMaxValue - YMinValue)) & "' height='" & INT(50 * DIVIDE([SUM Gross Sales] - YMinValue,YMaxValue - YMinValue)) & "'  fill='"&LineColour&"'/>")

// Last data points on the line
VAR LastSparkYValue = MAXX( FILTER(SparklineTable, financials[Date] = XMaxDate), [Y])
VAR LastSparkXValue = MAXX( FILTER(SparklineTable, financials[Date] = XMaxDate), [X])

// Add to SVG, and verify Data Category is set to Image URL for this measure
VAR SVGImageURL =
    "data:image/svg+xml;utf8," &
    --- gradient---
    "<svg xmlns='http://www.w3.org/2000/svg' x='0px' y='0px' viewBox='-7 -7 164 64'>" &
    --- Bars ---
        CONCATENATEX(BarTable,[@Bars]) &
    --- Points ---
        CONCATENATEX(PointTable,[@Points]) &
    --- Last Point ---
        "<circle cx='"& LastSparkXValue & "' cy='" & 50 - LastSparkYValue & "' r='4' stroke='" & LineColour & "' stroke-width='3' fill='" & PointColour & "' />" &
        "</svg>"

RETURN SVGImageURL
Sparkline Points =
// Static line color - use %23 instead of # for Firefox compatibility (Measure Derived from Eldersveld Modified by Kolosko)
VAR LineColour = "%23118DFF"
VAR PointColour = "white"
// "Date" field used in this example along the X axis
VAR XMinDate = MIN(financials[Date])
VAR XMaxDate = MAX(financials[Date])
// Obtain overall min and overall max measure values when evaluated for each date
VAR YMinValue = MINX(Values(financials[Date]),CALCULATE([SUM Gross Sales]))
VAR YMaxValue = MAXX(Values(financials[Date]),CALCULATE([SUM Gross Sales]))
// Build table of X & Y coordinates and fit to 50 x 150 viewbox
VAR SparklineTable = ADDCOLUMNS(
SUMMARIZE('financials',financials[Date]),
"X",INT(150 * DIVIDE(financials[Date] - XMinDate, XMaxDate - XMinDate)),
"Y",INT(50 * DIVIDE([SUM Gross Sales] - YMinValue,YMaxValue - YMinValue)))
// Concatenate X & Y coordinates to build the sparkline
VAR Lines = CONCATENATEX(SparklineTable,[X] & "," & 50-[Y]," ", financials[Date])
VAR PointTable=
ADDCOLUMNS(
SUMMARIZE('financials',financials[Date]),
"@Colour",IF([SUM Gross Sales]=YMaxValue,"Green",IF([SUM Gross Sales]=YMinValue,"Red",LineColour)),
"@Points", "<circle cx='"&INT(150 * DIVIDE(financials[Date] - XMinDate, XMaxDate - XMinDate))&"' cy='" & 50 - INT(50 * DIVIDE([SUM Gross Sales] - YMinValue,YMaxValue - YMinValue)) & "' r='3' stroke='"&LineColour&"' stroke-width='1' fill='"&LineColour&"'/>")
// Last data points on the line
VAR LastSparkYValue = MAXX( FILTER(SparklineTable, financials[Date] = XMaxDate), [Y])
VAR LastSparkXValue = MAXX( FILTER(SparklineTable, financials[Date] = XMaxDate), [X])
// Add to SVG, and verify Data Category is set to Image URL for this measure
VAR SVGImageURL =
"data:image/svg+xml;utf8," &
--- gradient---
"<svg xmlns='http://www.w3.org/2000/svg' x='0px' y='0px' viewBox='-7 -7 164 64'>" &
--- Lines---
"<polyline
fill='transparent' stroke='" & LineColour & "'
stroke-linecap='round' stroke-linejoin='round'
stroke-width='2' points=' " & Lines &
" '/>" &
--- Last Point---
CONCATENATEX(PointTable,[@Points]) &
"<circle cx='"& LastSparkXValue & "' cy='" & 50 - LastSparkYValue & "' r='4' stroke='" & LineColour & "' stroke-width='3' fill='" & PointColour & "' />" &
"</svg>"
RETURN SVGImageURLSquare Lollipop (provided by Federico Pastor)
Code for Square lollipop in case you want to use it. Thanks for the tips.

Square Lollipop =
// Static line color - use %23 instead of # for Firefox compatibility (Measure Derived from Eldersveld Modified by Kolosko)
VAR LineColour = "black"
VAR PointColour = "White" // "Date" field used in this example along the X axis
VAR XMinDate =
MIN ( financials[date] )
VAR XMaxDate =
MAX ( financials[date] ) // Obtain overall min and overall max measure values when evaluated for each date
VAR YMinValue =
MINX ( VALUES ( financials[date] ), CALCULATE ( [Net Sales] ) )
VAR YMaxValue =
MAXX ( VALUES ( financials[date] ), CALCULATE ( [Net Sales] ) ) // Build table of X & Y coordinates and fit to 50 x 150 viewbox
VAR SparklineTable =
ADDCOLUMNS (
SUMMARIZE ( 'financials', financials[date] ),
"X",
INT ( 150 * DIVIDE ( financials[date] - XMinDate, XMaxDate - XMinDate ) ),
"Y",
INT ( 50 * DIVIDE ( [Net Sales] - YMinValue, YMaxValue - YMinValue ) )
) // Concatenate X & Y coordinates to build the sparkline
VAR Lines =
CONCATENATEX ( SparklineTable, [X] & "," & 50 - [Y], " ", financials[date] )
VAR PointTable =
ADDCOLUMNS (
SUMMARIZE ( 'financials', financials[date] ),
"@Colour",
IF (
[Net Sales] = YMaxValue,
"Green",
IF ( [Net Sales] = YMinValue, "Red", LineColour )
),
"@Points",
"<rect x='"
& INT ( 150 * DIVIDE ( financials[Date] - XMinDate, XMaxDate - XMinDate ) ) - 2.50 & "' y='"
& 50
- INT ( 50 * DIVIDE ( [Net Sales] - YMinValue, YMaxValue - YMinValue ) ) - 2 & "' width='6' height='6' fill='" & LineColour & "'/>"
)
VAR BarTable =
ADDCOLUMNS (
SUMMARIZE ( 'financials', financials[date] ),
"@Colour",
IF (
[Net Sales] = YMaxValue,
"Green",
IF ( [Net Sales] = YMinValue, "Red", LineColour )
),
"@Bars",
"<rect x='"
& INT ( 150 * DIVIDE ( financials[date] - XMinDate, XMaxDate - XMinDate ) ) & "' width='0.5' stroke='" & LineColour & "' stroke-width='0.5' y='"
& 50
- INT ( 50 * DIVIDE ( [Net Sales] - YMinValue, YMaxValue - YMinValue ) ) & "' height='"
& INT ( 50 * DIVIDE ( [Net Sales] - YMinValue, YMaxValue - YMinValue ) ) & "' fill='" & LineColour & "'/>"
) // Last data points on the line
VAR LastSparkYValue =
MAXX ( FILTER ( SparklineTable, financials[date] = XMaxDate ), [Y] )
VAR LastSparkXValue =
MAXX ( FILTER ( SparklineTable, financials[date] = XMaxDate ), [X] ) // Add to SVG, and verify Data Category is set to Image URL for this measure
VAR SVGImageURL =
"data:image/svg+xml;utf8," & --- gradient---
"<svg xmlns='http://www.w3.org/2000/svg' x='0px' y='0px' viewBox='-7 -7 164 64'>"
& --- Bars ---
CONCATENATEX ( BarTable, [@Bars] )
& --- Points ---
CONCATENATEX ( PointTable, [@Points] ) & --- Last Point ---
"<rect x='" & LastSparkXValue - 2 + 0.060 & "' y='" & 50 - LastSparkYValue - 2 & "' width='5' height='5' stroke='" & LineColour & "' stroke-width='3' fill='" & PointColour & "' />" & "</svg>"
RETURN
SVGImageURL
Additional Sparklines :
To celebrate my catching-up, a new sparkline example (03.06) has been added to the workbook I did for the recent Wellington meetup to make more use of the horizontal plane – you can download here: https://t.co/jgXqJ17yNW pic.twitter.com/oqoquIievC
— Daniel Marsh-Patrick (@the_d_mp) May 2, 2023