
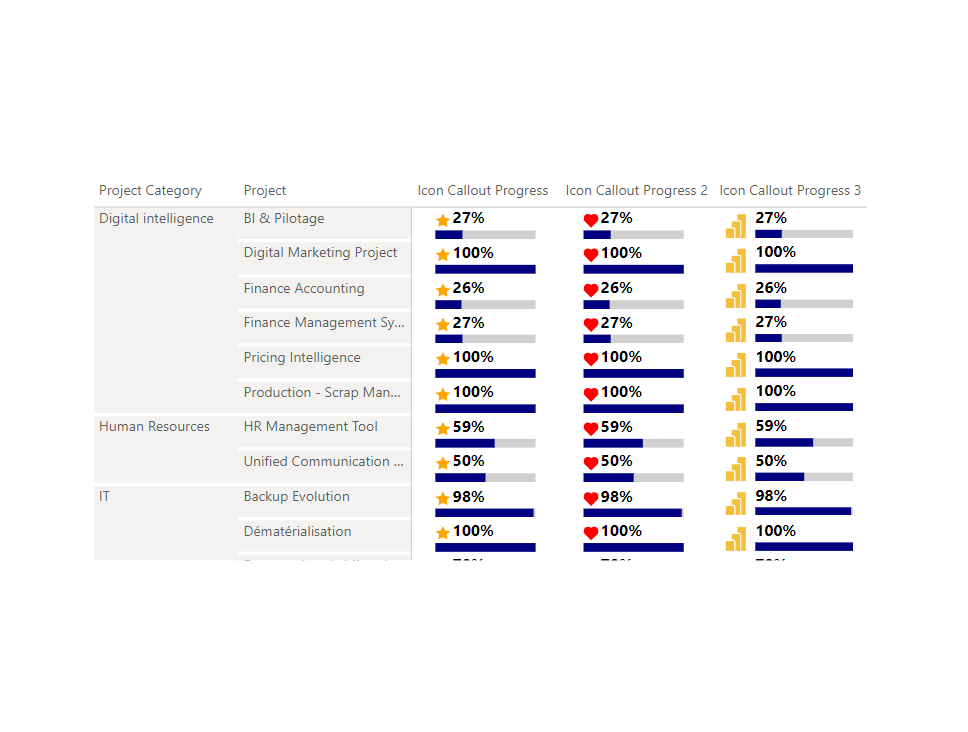
Style 1 (icon above bar)
Icon Callout Progress =
--- Field to sort the measures by in a table ---
VAR SORT = DIVIDE(SUM(Projects[Consumed Budget]),SUM(Projects[Budget]))*100
--- Progress Bar Info ---
VAR PERCENTAGEFILL = Max(Projects[Progress %])*100
VAR BarColour = "Navy"
--- svg symbol in its own coordinate system ---
--- replace with your own svg but ensure to place id tag id='mySymbol'---
VAR Symbol =
  "<symbol id='mySymbol' width='10' height='10' viewBox='0 0 2 2'>
    <circle cx='1' cy='1' r='1' />
  </symbol>"
VAR Symbol1 =
  "<symbol id='mySymbol' width='15' height='15' viewBox='-1 -1 2 2'>
    <path fill='orange' d='M0,.5L.6,.8L.5,.1L1,-.3L.3,-.4L0,-1L-.3,-.4L-1,-.3L-.5,.1L-.6,.8L0,.5Z'/>
  </symbol>"
VAR Symbol2 =
  "<symbol id='mySymbol' width='15' height='15' viewBox='-1 -1 2 2'>
    <path d='M.83.09,0,.91-.83.09a.59.59,0,0,1,0-.83A.59.59,0,0,1,0-.74a.59.59,0,0,1,.83,0A.59.59,0,0,1,.83.09Z'/>
  </symbol>"
VAR Symbol3 =
  "<symbol id='mySymbol' width='15' height='15' viewBox='0 0 1220 1601'>
    <g transform='translate(-1681 -906)'><path d='M2342 993.77C2342 962.969 2366.97 938 2397.77 938L2813.2 938C2844 938 2868.97 962.969 2868.97 993.77L2868.97 2419.23C2868.97 2450.03 2844 2475 2813.2 2475L2397.77 2475C2366.97 2475 2342 2450.03 2342 2419.23Z' stroke='#FFFFFF' stroke-width='64.1667' stroke-miterlimit='8' fill='#F4BF3D' fill-rule='evenodd'/><path d='M2032 1380.79C2032 1349.98 2056.98 1325 2087.8 1325L2503.48 1325C2534.3 1325 2559.28 1349.98 2559.28 1380.79 2559.85 1745.42 2560.43 2110.05 2561 2474.68 2532.64 2475.43 2534.3 2474.63 2503.48 2474.63L2087.8 2474.63C2056.98 2474.63 2032 2449.65 2032 2418.84L2032 1380.79Z' stroke='#FFFFFF' stroke-width='64.1667' stroke-miterlimit='8' fill='#F4BF3D' fill-rule='evenodd'/><path d='M1713 1769.35C1713 1732.15 1743.21 1702 1780.47 1702L2167.81 1702C2205.07 1702 2235.28 1732.15 2235.28 1769.35 2235.85 2003.9 2236.43 2238.45 2237 2473L2167.81 2472.79 1780.47 2472.79C1743.21 2472.79 1713 2442.63 1713 2405.43L1713 1769.35Z' stroke='#FFFFFF' stroke-width='64.1667' stroke-miterlimit='8' fill='#F4BF3D' fill-rule='evenodd'/></g>
  </symbol>"
RETURN
IF(HASONEVALUE(Projects[Project]),
"data:image/svg+xml;utf8," &
"<svg desc = '" & SORT & "' width='100' height='30' viewBox='-2 -2 105 20' xmlns='http://www.w3.org/2000/svg' xmlns:xlink='http://www.w3.org/1999/xlink' display= 'block'  overflow='visible'>
<rect id='track' x='0' y='15' rx='0' ry='0' width='100' height='10' fill='#D0D0D0' />
" & Symbol1 & "
<rect id='fill' x='0' y='15' rx='0' ry='0' width="& "'"& PERCENTAGEFILL &"'"&" height='10' fill='"&BarColour&"'></rect>
<use href='#mySymbol' x='0' y='-2' style='opacity:1.0' />
<text x='17' y='8' font-weight='bold' font-family='Segoe UI, sans-serif' >"&FORMAT(PERCENTAGEFILL/100, "0%")&"</text>
</svg>"
, BLANK())
Style 2 (icon beside bar)
Icon Callout Progress 3 =
--- Field to sort the measures by in a table ---
VAR SORT = DIVIDE(SUM(Projects[Consumed Budget]),SUM(Projects[Budget]))*100
--- Progress Bar Info ---
VAR PERCENTAGEFILL = Max(Projects[Progress %])*100
VAR BarColour = "Navy"
--- svg symbol in its own coordinate system ---
--- replace with your own svg but ensure to place id tag id='mySymbol'---
VAR Symbol =
  "<symbol id='mySymbol' width='10' height='10' viewBox='0 0 2 2'>
    <circle cx='1' cy='1' r='1' />
  </symbol>"
VAR Symbol1 =
  "<symbol id='mySymbol' width='30' height='30' viewBox='-1 -1 2 2'>
    <path fill='orange' d='M0,.5L.6,.8L.5,.1L1,-.3L.3,-.4L0,-1L-.3,-.4L-1,-.3L-.5,.1L-.6,.8L0,.5Z'/>
  </symbol>"
VAR Symbol2 =
  "<symbol id='mySymbol' width='30' height='30' viewBox='-1 -1 2 2'>
    <path fill='red' d='M.83.09,0,.91-.83.09a.59.59,0,0,1,0-.83A.59.59,0,0,1,0-.74a.59.59,0,0,1,.83,0A.59.59,0,0,1,.83.09Z'/>
  </symbol>"
VAR Symbol3 =
  "<symbol id='mySymbol' width='30' height='30' viewBox='0 0 1220 1601'>
    <g transform='translate(-1681 -906)'><path d='M2342 993.77C2342 962.969 2366.97 938 2397.77 938L2813.2 938C2844 938 2868.97 962.969 2868.97 993.77L2868.97 2419.23C2868.97 2450.03 2844 2475 2813.2 2475L2397.77 2475C2366.97 2475 2342 2450.03 2342 2419.23Z' stroke='#FFFFFF' stroke-width='64.1667' stroke-miterlimit='8' fill='#F4BF3D' fill-rule='evenodd'/><path d='M2032 1380.79C2032 1349.98 2056.98 1325 2087.8 1325L2503.48 1325C2534.3 1325 2559.28 1349.98 2559.28 1380.79 2559.85 1745.42 2560.43 2110.05 2561 2474.68 2532.64 2475.43 2534.3 2474.63 2503.48 2474.63L2087.8 2474.63C2056.98 2474.63 2032 2449.65 2032 2418.84L2032 1380.79Z' stroke='#FFFFFF' stroke-width='64.1667' stroke-miterlimit='8' fill='#F4BF3D' fill-rule='evenodd'/><path d='M1713 1769.35C1713 1732.15 1743.21 1702 1780.47 1702L2167.81 1702C2205.07 1702 2235.28 1732.15 2235.28 1769.35 2235.85 2003.9 2236.43 2238.45 2237 2473L2167.81 2472.79 1780.47 2472.79C1743.21 2472.79 1713 2442.63 1713 2405.43L1713 1769.35Z' stroke='#FFFFFF' stroke-width='64.1667' stroke-miterlimit='8' fill='#F4BF3D' fill-rule='evenodd'/></g>
  </symbol>"
RETURN
IF(HASONEVALUE(Projects[Project]),
"data:image/svg+xml;utf8," &
"<svg desc = '" & SORT & "' width='135' height='30' viewBox='-2 -2 140 20' xmlns='http://www.w3.org/2000/svg' xmlns:xlink='http://www.w3.org/1999/xlink' display= 'block'  overflow='visible'>
<rect id='track' x='35' y='15' rx='0' ry='0' width='100' height='10' fill='#D0D0D0' />
" & Symbol3 & "
<rect id='fill' x='35' y='15' rx='0' ry='0' width="& "'"& PERCENTAGEFILL &"'"&" height='10' fill='"&BarColour&"'></rect>
<use href='#mySymbol' x='0' y='-2' style='opacity:1.0' />
<text x='35' y='8' font-weight='bold' font-family='Segoe UI, sans-serif' >"&FORMAT(PERCENTAGEFILL/100, "0%")&"</text>
</svg>"
, BLANK())
genial, muchas gracias por compartir… Tengo una duda, cómo haces para que la categoría del proyecto no se repita por cada proyecto y solo te muestre una única vez?
Eso es muy simple, lo haces en la parte de Visualizaciones en la matriz, quitas el diseño escalonado y ya.