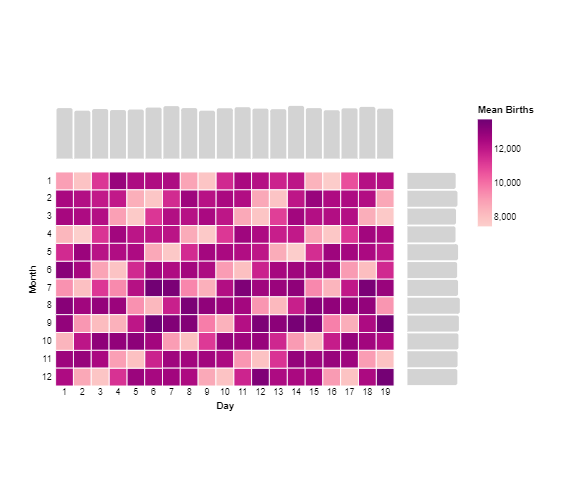
{
  "$schema": "https://vega.github.io/schema/vega-lite/v5.json",
  "usermeta": {
    "deneb": {
      "build": "1.0.0.157",
      "metaVersion": 1,
      "provider": "vegaLite"
    },
    "interactivity": {
      "tooltip": true,
      "contextMenu": true,
      "selection": false,
      "dataPointLimit": 50
    },
    "information": {
      "name": "Heatmap with bars",
      "description": "[No Description Provided]",
      "author": "Kerry Kolosko",
      "uuid": "0ab57382-bcb3-422a-b71e-f38050792252",
      "generated": "2022-02-02T12:51:14.408Z"
    },
    "dataset": [
      {
        "key": "__0__",
        "name": "x",
        "description": "",
        "type": "numeric",
        "kind": "column"
      },
      {
        "key": "__1__",
        "name": "y",
        "description": "",
        "type": "numeric",
        "kind": "column"
      },
      {
        "key": "__2__",
        "name": "Value",
        "description": "",
        "type": "numeric",
        "kind": "measure"
      }
    ]
  },
  "config": {
    "autosize": {
      "type": "fit",
      "contains": "padding"
    },
    "view": {"stroke": "transparent"}
  },
  "data": {"name": "dataset"},
  "spacing": 15,
  "bounds": "flush",
  "vconcat": [
    {
      "height": 60,
      "mark": {
        "type": "bar",
        "stroke": null,
        "cornerRadiusEnd": 2,
        "tooltip": true,
        "color": "lightgrey"
      },
      "encoding": {
        "x": {
          "field": "__1__",
          "axis": null
        },
        "y": {
          "field": "__2__",
          "aggregate": "mean",
          "axis": null
        }
      }
    },
    {
      "spacing": 15,
      "bounds": "flush",
      "hconcat": [
        {
          "mark": {
            "type": "rect",
            "stroke": "white",
            "tooltip": true
          },
          "encoding": {
            "y": {
              "field": "__0__",
              "type": "ordinal",
              "title": "Month",
              "axis": {
                "domain": false,
                "ticks": false,
                "labels": true,
                "labelAngle": 0,
                "labelPadding": 5
              }
            },
            "x": {
              "field": "__1__",
              "type": "ordinal",
              "title": "Day",
              "axis": {
                "domain": false,
                "ticks": false,
                "labels": true,
                "labelAngle": 0
              }
            },
            "color": {
              "aggregate": "mean",
              "field": "__2__",
              "type": "quantitative",
              "title": "Mean Births",
              "legend": {
                "direction": "vertical",
                "gradientLength": 120
              }
            }
          }
        },
        {
          "mark": {
            "type": "bar",
            "stroke": null,
            "cornerRadiusEnd": 2,
            "tooltip": true,
            "color": "lightgrey"
          },
          "width": 60,
          "encoding": {
            "y": {
              "field": "__0__",
              "axis": null
            },
            "x": {
              "field": "__2__",
              "type": "quantitative",
              "aggregate": "mean",
              "axis": null
            }
          }
        }
      ]
    }
  ]
}


How we add data labels in the heatmap
You could follow this example https://vega.github.io/vega-lite/examples/layer_text_heatmap.html