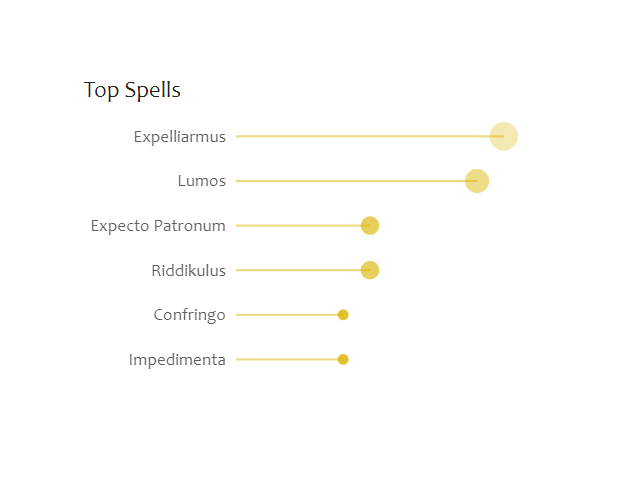
{
  "$schema": "https://vega.github.io/schema/vega-lite/v5.json",
  "usermeta": {
    "deneb": {
      "build": "1.0.0.157",
      "metaVersion": 1,
      "provider": "vegaLite"
    },
    "interactivity": {
      "tooltip": true,
      "contextMenu": true,
      "selection": true,
      "dataPointLimit": 50
    },
    "information": {
      "name": "Sized Lollipop",
      "description": "[No Description Provided]",
      "author": "Kerry Kolosko",
      "uuid": "d126e415-0a80-4812-9d6e-6229e0731af8",
      "generated": "2022-02-02T13:07:33.139Z"
    },
    "dataset": [
      {
        "key": "__0__",
        "name": "Category",
        "description": "",
        "type": "text",
        "kind": "column"
      },
      {
        "key": "__1__",
        "name": "Value",
        "description": "",
        "type": "numeric",
        "kind": "measure"
      }
    ]
  },
  "config": {
    "autosize": {
      "type": "fit",
      "contains": "padding"
    },
    "view": {"stroke": "transparent"}
  },
  "data": {"name": "dataset"},
  "encoding": {
    "y": {
      "field": "__0__",
      "type": "nominal",
      "sort": "-x",
      "axis": {
        "domain": false,
        "title": null,
        "ticks": false,
        "labelFont": "Candara",
        "labelFontSize": 16,
        "labelPadding": 10,
        "labelColor": "#605e5c"
      }
    },
    "x": {
      "field": "__1__",
      "type": "quantitative",
      "axis": null
    },
    "opacity": {
      "condition": {
        "test": {
          "field": "__selected__",
          "equal": "off"
        },
        "value": 0.3
      }
    },
    "color": {"value": "#d9b300"}
  },
  "layer": [
    {
      "mark": {
        "type": "rule",
        "tooltip": true,
        "strokeWidth": 2,
        "opacity": 0.5
      }
    },
    {
      "mark": {
        "type": "circle",
        "tooltip": true,
        "size": 200
      },
      "encoding": {
        "size": {
          "field": "__1__",
          "scale": {
            "range": [100, 700]
          },
          "legend": false
        },
        "opacity": {
          "field": "__1__",
          "sort": "-x",
          "legend": false
        }
      }
    }
  ]
}


Fantastic Kerry. Was looking for a good lollipop chart.
This is great.