
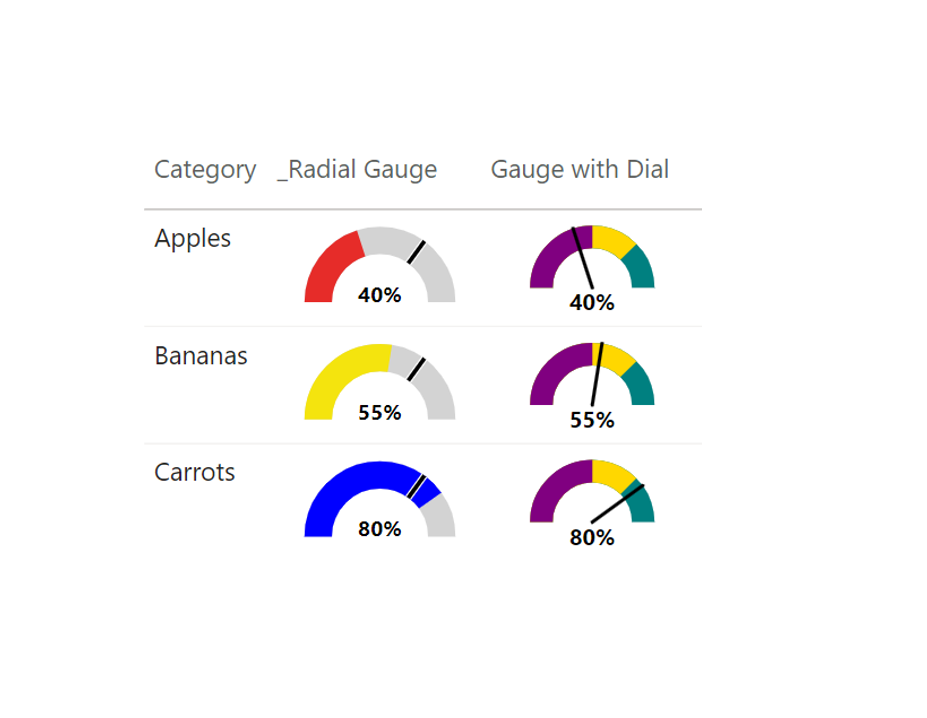
Conditional Colour Gauge
Radial Gauge =

VAR MAXPlan = 1 // enter value or measure

VAR MAXActual = SUM(Gauges[Percentage]) // enter value or measure

VAR MAXTarget = 0.7 // enter value or measure

VAR AXISRANGE = MAXX(

    {

        MAXPlan,

        MAXActual,

        MAXTarget

    },

    [Value]

)

VAR TRACKWIDTH = MAXPlan/AXISRANGE*100

VAR PERCENTAGEFILL = MAXActual/AXISRANGE

VAR PERCENTAGETARGET = MAXTarget/AXISRANGE

RETURN

"data:image/svg+xml;charset=utf-8, <svg xmlns='http://www.w3.org/2000/svg' xmlns:xlink='http://www.w3.org/1999/xlink' width= '100' height= '50' display= 'block' viewBox='-5 -5 110 70' overflow='visible'>

      <path id='track' fill='none' stroke='lightgrey' d='M10,55 a45,45 0 1 1 90,0' stroke-width='20' />

      <path id='fill' fill='none' stroke="&IF(PERCENTAGEFILL<0.50,"'#e62c29'",IF(PERCENTAGEFILL<0.65,"'#F4E40E'","'blue'"))&" d='M10,55 a45,45 0 1 1 90,0' stroke-width='20' stroke-dasharray='141.3717' stroke-dashoffset="&"'"&(1-PERCENTAGEFILL) * (PI()*45)&"'"&"></path>

      <path id='target' fill='black' stroke='white' d='M0,55 L20,55' stroke-width='5' transform='rotate("&PERCENTAGETARGET*180&" 55 55)'/>

      <path id='target' fill='black' stroke='black' d='M0,55 L20,55' stroke-width='3' transform='rotate("&PERCENTAGETARGET*180&" 55 55)'/>

      <text x='55' y='55' text-anchor='middle' font-family='Segoe UI' font-weight='bold' >"&FORMAT(PERCENTAGEFILL, "0%")&"</text>

    </svg>" //Target Marker = Percent of Total * 180 degrees; Gauge Fill = Percent of Total * πr
Gauge with dial and states
Gauge with Dial =

VAR StateA = 50 // enter value or measure

VAR StateB = 75 // enter value or measure

VAR StateC = 100 // enter value or measure

VAR Counter = MAX(Gauges[Percentage]) // enter measure

VAR AXISRANGE = MAXX(

    {

        StateA,

        StateB,

        StateC,

        Counter

    },

    [Value]

)

VAR StateC_Width = DIVIDE(StateC,AXISRANGE)

VAR StateB_Width = DIVIDE(StateB,AXISRANGE)

VAR StateA_Width = DIVIDE(StateA,AXISRANGE)


VAR StateA_Colour = "purple"

VAR StateB_Colour = "gold"

VAR StateC_Colour = "teal"


RETURN

"data:image/svg+xml;charset=utf-8, <svg xmlns='http://www.w3.org/2000/svg' xmlns:xlink='http://www.w3.org/1999/xlink' width= '100' height= '50' display= 'block' viewBox='-5 -5 110 85' overflow='visible'>

      <path id='track' fill='none' stroke='lightgrey' d='M10,55 a45,45 0 1 1 90,0' stroke-width='20' />


      <path id='stateC' fill='none' stroke='"&StateC_Colour&"' d='M10,55 a45,45 0 1 1 90,0' stroke-width='20' stroke-dasharray='141.3717' stroke-dashoffset="&"'"&(1-StateC_Width) * (PI()*45)&"'"&"></path>


      <path id='stateB' fill='none' stroke='"&StateB_Colour&"' d='M10,55 a45,45 0 1 1 90,0' stroke-width='20' stroke-dasharray='141.3717' stroke-dashoffset="&"'"&(1-StateB_Width) * (PI()*45)&"'"&"></path>


      <path id='stateA' fill='none' stroke='"&StateA_Colour&"' d='M10,55 a45,45 0 1 1 90,0' stroke-width='20' stroke-dasharray='141.3717' stroke-dashoffset="&"'"&(1-StateA_Width) * (PI()*45)&"'"&"></path>


      <path id='dial' fill='none' stroke='black' d='M0,55 L55,55' stroke-width='3' stroke-linecap='round'  transform='rotate("&Counter*180&" 55 55)'/>

      <text x='55' y='75' text-anchor='middle' font-family='Segoe UI' font-size='20' font-weight='bold' >"&FORMAT(Counter, "0%")&"</text>

    </svg>" //Target Marker = Percent of Total * 180 degrees; Gauge Fill = Percent of Total * πr