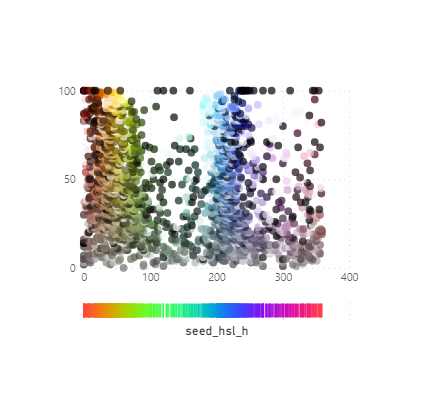
{
  "$schema": "https://vega.github.io/schema/vega-lite/v5.json",
  "usermeta": {
    "deneb": {
      "build": "1.5.1.0",
      "metaVersion": 1,
      "provider": "vegaLite",
      "providerVersion": "5.6.1"
    },
    "interactivity": {
      "tooltip": true,
      "contextMenu": true,
      "selection": false,
      "highlight": false,
      "dataPointLimit": 50
    },
    "information": {
      "name": "Strip Dot Plot",
      "description": "[No Description Provided]",
      "author": "Kerry Kolosko",
      "uuid": "2c5fd7ba-8a99-4364-9d60-7ca3bd4ecb7a",
      "generated": "2023-07-21T13:44:39.517Z"
    },
    "dataset": [
      {
        "key": "__0__",
        "name": "Y",
        "description": "",
        "type": "numeric",
        "kind": "column"
      },
      {
        "key": "__1__",
        "name": "X",
        "description": "",
        "type": "numeric",
        "kind": "column"
      },
      {
        "key": "__2__",
        "name": "Colour",
        "description": "",
        "type": "text",
        "kind": "column"
      }
    ]
  },
  "config": {
    "view": {"stroke": "transparent"},
    "font": "Segoe UI",
    "arc": {},
    "area": {
      "line": true,
      "opacity": 0.6
    },
    "bar": {},
    "line": {
      "strokeWidth": 3,
      "strokeCap": "round",
      "strokeJoin": "round"
    },
    "path": {},
    "point": {
      "filled": true,
      "size": 75
    },
    "rect": {},
    "shape": {},
    "symbol": {
      "strokeWidth": 1.5,
      "size": 50
    },
    "text": {
      "font": "Segoe UI",
      "fontSize": 12,
      "fill": "#605E5C"
    },
    "axis": {
      "ticks": false,
      "grid": false,
      "domain": false,
      "labelColor": "#605E5C",
      "labelFontSize": 12,
      "titleFont": "wf_standard-font, helvetica, arial, sans-serif",
      "titleColor": "#252423",
      "titleFontSize": 16,
      "titleFontWeight": "normal"
    },
    "axisQuantitative": {
      "tickCount": 3,
      "grid": true,
      "gridColor": "#C8C6C4",
      "gridDash": [1, 5],
      "labelFlush": false
    },
    "axisX": {"labelPadding": 5},
    "axisY": {"labelPadding": 10},
    "header": {
      "titleFont": "wf_standard-font, helvetica, arial, sans-serif",
      "titleFontSize": 16,
      "titleColor": "#252423",
      "labelFont": "Segoe UI",
      "labelFontSize": 13.333333333333332,
      "labelColor": "#605E5C"
    },
    "legend": {
      "titleFont": "Segoe UI",
      "titleFontWeight": "bold",
      "titleColor": "#605E5C",
      "labelFont": "Segoe UI",
      "labelFontSize": 13.333333333333332,
      "labelColor": "#605E5C",
      "symbolType": "circle",
      "symbolSize": 75
    }
  },
  "data": {"name": "dataset"},
  "vconcat": [
    {
      "width": 300,
      "mark": "point",
      "description": "dot plot",
      "encoding": {
        "x": {
          "field": "__1__",
          "type": "quantitative",
          "axis": {"title": ""}
        },
        "y": {
          "field": "__0__",
          "type": "quantitative",
          "axis": {"title": ""}
        },
        "color": {
          "field": "__2__",
          "type": "nominal",
          "legend": null,
          "scale": null
        }
      }
    },
    {
      "width": 300,
      "mark": "tick",
      "description": "x-axis dash plot",
      "encoding": {
        "x": {
          "field": "__1__",
          "type": "quantitative",
          "axis": {
            "labels": false,
            "domain": false,
            "ticks": false
          }
        },
        "color": {
          "field": "__1__",
          "type": "nominal",
          "scale": {"scheme": "sinebow"}
        }
      }
    }
  ]
}

