
To use colour codes from a field or measure set “color”: { “scale”: null }, to use categorical colours remove “color”: { “scale”: null } from the JSON
{
"$schema": "https://vega.github.io/schema/vega-lite/v5.json",
"usermeta": {
"deneb": {
"build": "1.5.1.0",
"metaVersion": 1,
"provider": "vegaLite",
"providerVersion": "5.6.1"
},
"interactivity": {
"tooltip": true,
"contextMenu": true,
"selection": false,
"highlight": false,
"dataPointLimit": 50
},
"information": {
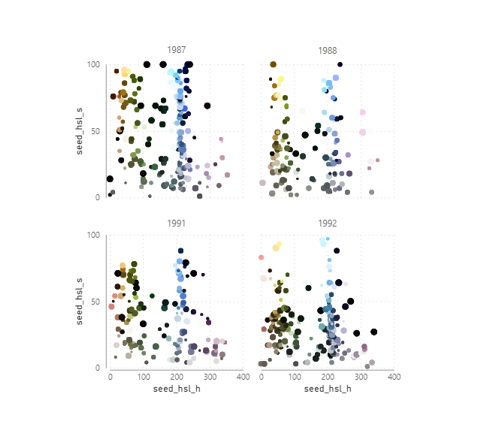
"name": "Small Multiple Bubble Plot",
"description": "[No Description Provided]",
"author": "Kerry Kolosko",
"uuid": "eee05ae1-d991-40cd-919e-eaa0d9337061",
"generated": "2023-07-21T13:10:29.315Z"
},
"dataset": [
{
"key": "__0__",
"name": "seed_hsl_s",
"description": "",
"type": "numeric",
"kind": "column"
},
{
"key": "__1__",
"name": "seed_hsl_h",
"description": "",
"type": "numeric",
"kind": "column"
},
{
"key": "__2__",
"name": "Year",
"description": "",
"type": "numeric",
"kind": "column"
},
{
"key": "__3__",
"name": "Colour",
"description": "",
"type": "text",
"kind": "column"
},
{
"key": "__4__",
"name": "Bubble Size",
"description": "",
"type": "numeric",
"kind": "measure"
}
]
},
"config": {
"view": {"stroke": "transparent"},
"font": "Segoe UI",
"arc": {},
"area": {
"line": true,
"opacity": 0.6
},
"bar": {},
"line": {
"strokeWidth": 3,
"strokeCap": "round",
"strokeJoin": "round"
},
"path": {},
"point": {
"filled": true,
"size": 75
},
"rect": {},
"shape": {},
"symbol": {
"strokeWidth": 1.5,
"size": 50
},
"text": {
"font": "Segoe UI",
"fontSize": 12,
"fill": "#605E5C"
},
"axis": {
"ticks": false,
"grid": false,
"domain": true,
"labelColor": "#605E5C",
"labelFontSize": 12,
"titleFont": "wf_standard-font, helvetica, arial, sans-serif",
"titleColor": "#252423",
"titleFontSize": 16,
"titleFontWeight": "normal"
},
"axisQuantitative": {
"tickCount": 3,
"grid": true,
"gridColor": "#C8C6C4",
"gridDash": [1, 5],
"labelFlush": false
},
"axisX": {"labelPadding": 5},
"axisY": {"labelPadding": 10},
"header": {
"titleFont": "wf_standard-font, helvetica, arial, sans-serif",
"titleFontSize": 16,
"titleColor": "#252423",
"labelFont": "Segoe UI",
"labelFontSize": 13.333333333333332,
"labelColor": "#605E5C"
},
"legend": {
"titleFont": "Segoe UI",
"titleFontWeight": "bold",
"titleColor": "#605E5C",
"labelFont": "Segoe UI",
"labelFontSize": 13.333333333333332,
"labelColor": "#605E5C",
"symbolType": "circle",
"symbolSize": 75
}
},
"data": {"name": "dataset"},
"mark": {"type": "point"},
"height": {"step": 12},
"width": {"step": 24},
"encoding": {
"x": {
"field": "__1__",
"type": "quantitative"
},
"y": {
"field": "__0__",
"type": "quantitative"
},
"color": {
"field": "__3__",
"type": "nominal",
"legend": null,
"scale": null
},
"size": {
"field": "__4__",
"scale": {
"rangeMin": 10,
"rangeMax": 100
},
"legend": null
},
"facet": {
"field": "__2__",
"type": "ordinal",
"columns": 4
}
}
}