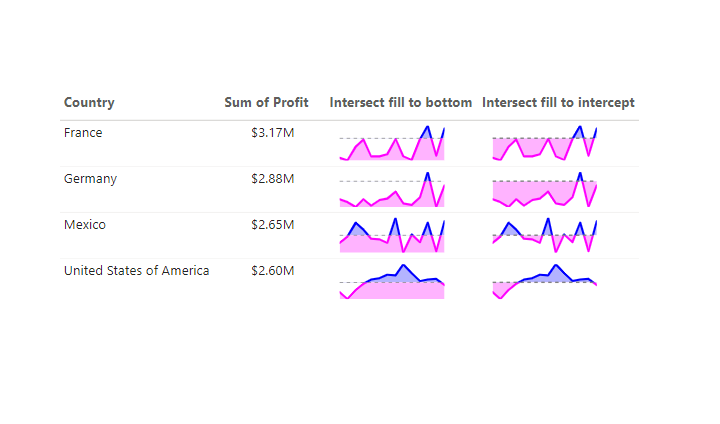
Fill to bottom
Sparkline with Intersect fill to bottom =
// developed by Kerry Kolosko
VAR topLineColour = "blue"
VAR bottomLineColour = "magenta"

// "Date" field used in this example along the X axis
VAR XMinDate = MIN(financials[Date])
VAR XMaxDate = MAX(financials[Date])

// Obtain overall min and overall max measure values when evaluated for each date
VAR YMinValue = MINX(Values(financials[Date]),CALCULATE([SUM Profit]))
VAR YMaxValue = MAXX(Values(financials[Date]),CALCULATE([SUM Profit]))

// Build table of X & Y coordinates and fit to 50 x 150 viewbox
VAR SparklineTable = ADDCOLUMNS(
    SUMMARIZE('financials',financials[Date]),
        "X",INT(150 * DIVIDE(financials[Date] - XMinDate, XMaxDate - XMinDate)),
        "Y",INT(50 * DIVIDE([SUM Profit] - YMinValue,YMaxValue - YMinValue)))

// Concatenate X & Y coordinates to build the sparkline
VAR Lines = CONCATENATEX(SparklineTable,[X] & "," & 50-[Y]," ", financials[Date])

// Y-Intersect to divide line colour
VAR lineIntersection = 0 // Enter the Y-intersecting value or measure here
VAR intersectScaled = 50 - (50 * DIVIDE(lineIntersection - YMinValue,YMaxValue - YMinValue))

VAR Defs =
"<defs>
    <clipPath id='cut-bottom'>
      <rect x='0' y='0' width='150' height='" & intersectScaled & "' />
    </clipPath>
    <clipPath id='cut-top'>
      <rect x='0' y='" & intersectScaled & "' width='150' height='" & 50-intersectScaled & "' />
    </clipPath>
</defs>"


// Add to SVG, and verify Data Category is set to Image URL for this measure (for non-table visuals remove IF HASONEVALUE)
VAR SVGImageURL =
IF(
    HASONEVALUE(financials[Country]),
    "data:image/svg+xml;utf8," &
    "<svg xmlns='http://www.w3.org/2000/svg' x='0px' y='0px' viewBox='-5 -5 160 60' >" & Defs &
    "<polyline id='bottomArea' fill='"&bottomLineColour&"' fill-opacity='0.3' stroke='" & bottomLineColour & "' stroke-width='0' points='0 50 " & Lines & " 150 50 Z' stroke-linecap='round' stroke-linejoin='round' clip-path='url(#cut-top)' />" &
    "<polyline id='bottomLine' fill='none' fill-opacity='0.3' stroke='" & bottomLineColour & "' stroke-width='3' points='" & Lines & "' stroke-linecap='round' stroke-linejoin='round' clip-path='url(#cut-top)' />" &
    "<polyline id='topArea' fill='"&topLineColour&"' fill-opacity='0.3' stroke='" & topLineColour & "' stroke-width='0' points='0 " & intersectScaled & " " & Lines & " 150 " & intersectScaled & " Z' stroke-linecap='round' stroke-linejoin='round' clip-path='url(#cut-bottom)' />" &
    "<polyline fill='none' stroke='" & topLineColour & "' stroke-width='3' points='" & Lines & "' stroke-linecap='round' stroke-linejoin='round' clip-path='url(#cut-bottom)' />" &
    "<line x1='0' y1='" & intersectScaled & "' x2='150' y2='" & intersectScaled & "' stroke ='grey' stroke-width ='1' stroke-dasharray='5,5' />" &
    "</svg>",
    BLANK()
)

RETURN SVGImageURL
Fill to Intercept
Sparkline with Intersect fill to intersect =
// developed by Kerry Kolosko
VAR topLineColour = "blue"
VAR bottomLineColour = "magenta"

// "Date" field used in this example along the X axis
VAR XMinDate = MIN(financials[Date])
VAR XMaxDate = MAX(financials[Date])

// Obtain overall min and overall max measure values when evaluated for each date
VAR YMinValue = MINX(Values(financials[Date]),CALCULATE([SUM Profit]))
VAR YMaxValue = MAXX(Values(financials[Date]),CALCULATE([SUM Profit]))

// Build table of X & Y coordinates and fit to 50 x 150 viewbox
VAR SparklineTable = ADDCOLUMNS(
    SUMMARIZE('financials',financials[Date]),
        "X",INT(150 * DIVIDE(financials[Date] - XMinDate, XMaxDate - XMinDate)),
        "Y",INT(50 * DIVIDE([SUM Profit] - YMinValue,YMaxValue - YMinValue)))

// Concatenate X & Y coordinates to build the sparkline
VAR Lines = CONCATENATEX(SparklineTable,[X] & "," & 50-[Y]," ", financials[Date])

// Y-Intersect to divide line colour
VAR lineIntersection = 0 // Enter the Y-intersecting value or measure here
VAR intersectScaled = 50 - INT(50 * DIVIDE(lineIntersection - YMinValue,YMaxValue - YMinValue))

VAR Defs =
"<defs>
    <clipPath id='cut-bottom'>
      <rect x='0' y='0' width='150' height='" & intersectScaled & "' />
    </clipPath>
    <clipPath id='cut-top'>
      <rect x='0' y='" & intersectScaled & "' width='150' height='" & 50-intersectScaled & "' />
    </clipPath>
</defs>"


// Add to SVG, and verify Data Category is set to Image URL for this measure (for non-table visuals remove IF HASONEVALUE)
VAR SVGImageURL =
IF(
    HASONEVALUE(financials[Country]),
    "data:image/svg+xml;utf8," &
    "<svg xmlns='http://www.w3.org/2000/svg' x='0px' y='0px' viewBox='-5 -5 160 60' >" & Defs &
    "<polyline id='bottomArea' fill='"&bottomLineColour&"' fill-opacity='0.3' stroke='" & bottomLineColour & "' stroke-width='0' points='0 " & intersectScaled & " " & Lines & " 150 " & intersectScaled & " Z' stroke-linecap='round' stroke-linejoin='round' clip-path='url(#cut-top)' />" &
    "<polyline id='bottomLine' fill='none' fill-opacity='0.3' stroke='" & bottomLineColour & "' stroke-width='3' points='" & Lines & "' stroke-linecap='round' stroke-linejoin='round' clip-path='url(#cut-top)' />" &
    "<polyline id='topArea' fill='"&topLineColour&"' fill-opacity='0.3' stroke='" & topLineColour & "' stroke-width='0' points='0 " & intersectScaled & " " & Lines & " 150 " & intersectScaled & " Z' stroke-linecap='round' stroke-linejoin='round' clip-path='url(#cut-bottom)' />" &
    "<polyline fill='none' stroke='" & topLineColour & "' stroke-width='3' points='" & Lines & "' stroke-linecap='round' stroke-linejoin='round' clip-path='url(#cut-bottom)' />" &
    "<line x1='0' y1='" & intersectScaled & "' x2='150' y2='" & intersectScaled & "' stroke ='grey' stroke-width ='2' stroke-dasharray='5,5' />" &
    "</svg>",
    BLANK()
)

RETURN SVGImageURL

Hi Kerry,
I’m using Fill to Bottom (thank you), and I believe the intersectScaled is inverted. The higher the lineIntersection value, the lower the line on the Sparkline image.
Thank you for pointing that out — you may be right, let me have look…
This is now corrected
What a great job you guys are doing. Thanks so greatly for making life easy with designs and a very appealing dashboards.
Please, can you include sample data template that aligns to each of your designs template to further make things at ease. You’ve done more than enough though, but that would go along way too.
Thanks