Skip to content
EXPLORATIONS IN DATA STORYTELLING WITH POWER BI

EXPLORATIONS IN DATA STORYTELLING WITH POWER BI

  • Home
  • Visualisations
  • Templates
    • Deneb Templates
    • SVG Templates
    • PlotlyJS Templates
  • About
  • LinkedIn
  • Twitter
  • YouTube
  • Instagram

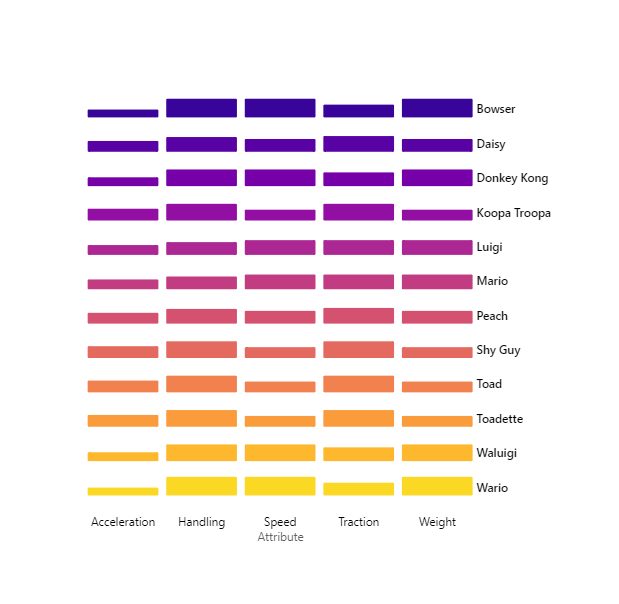
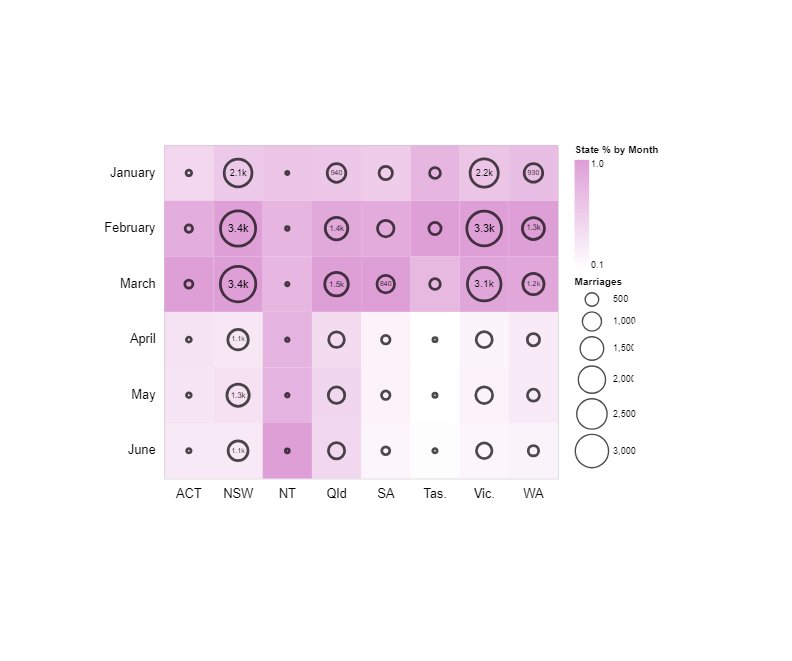
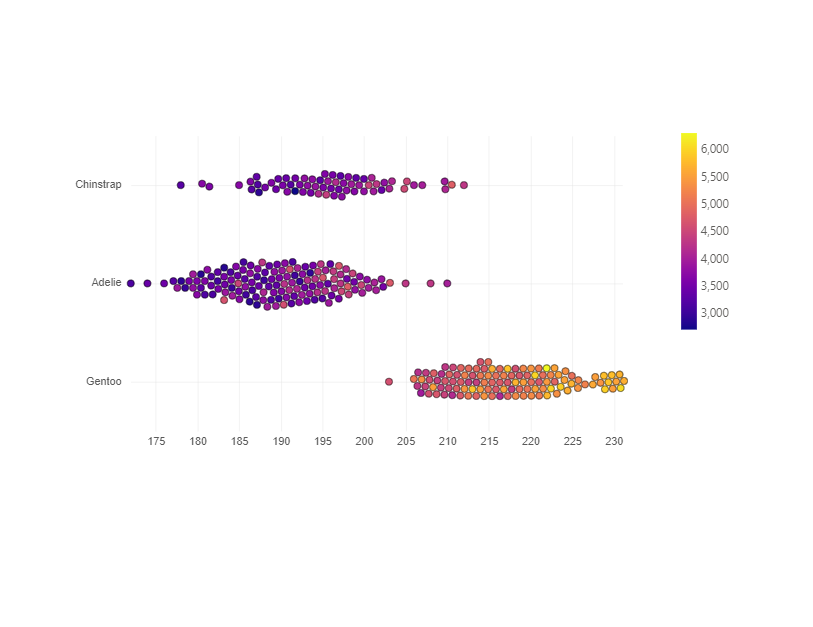
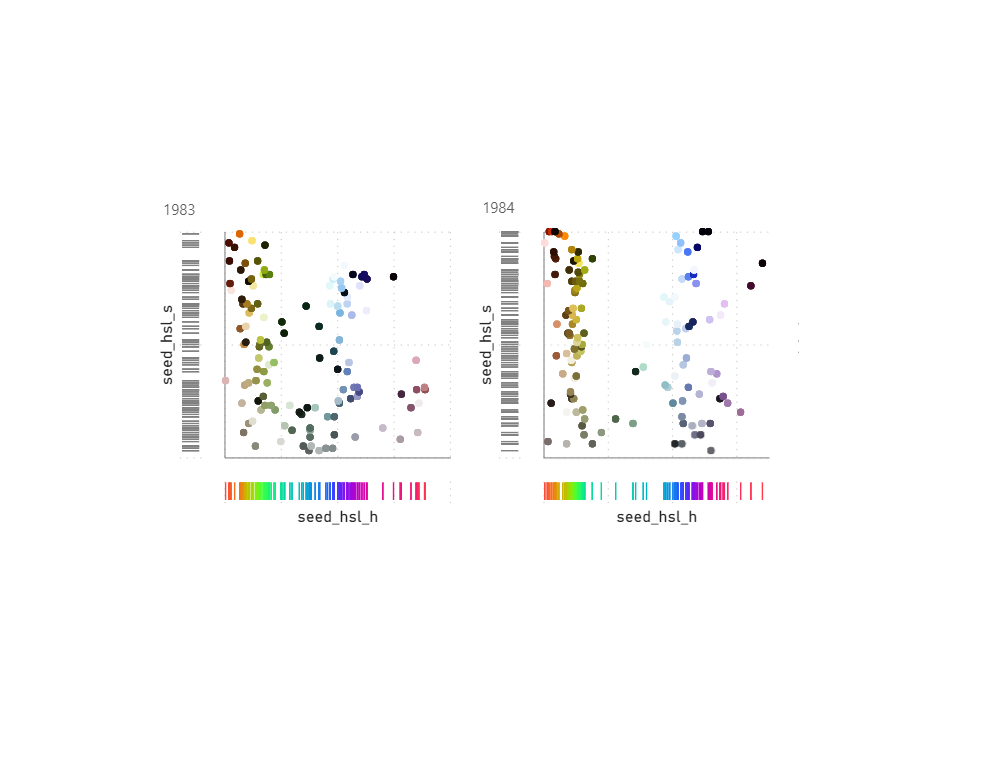
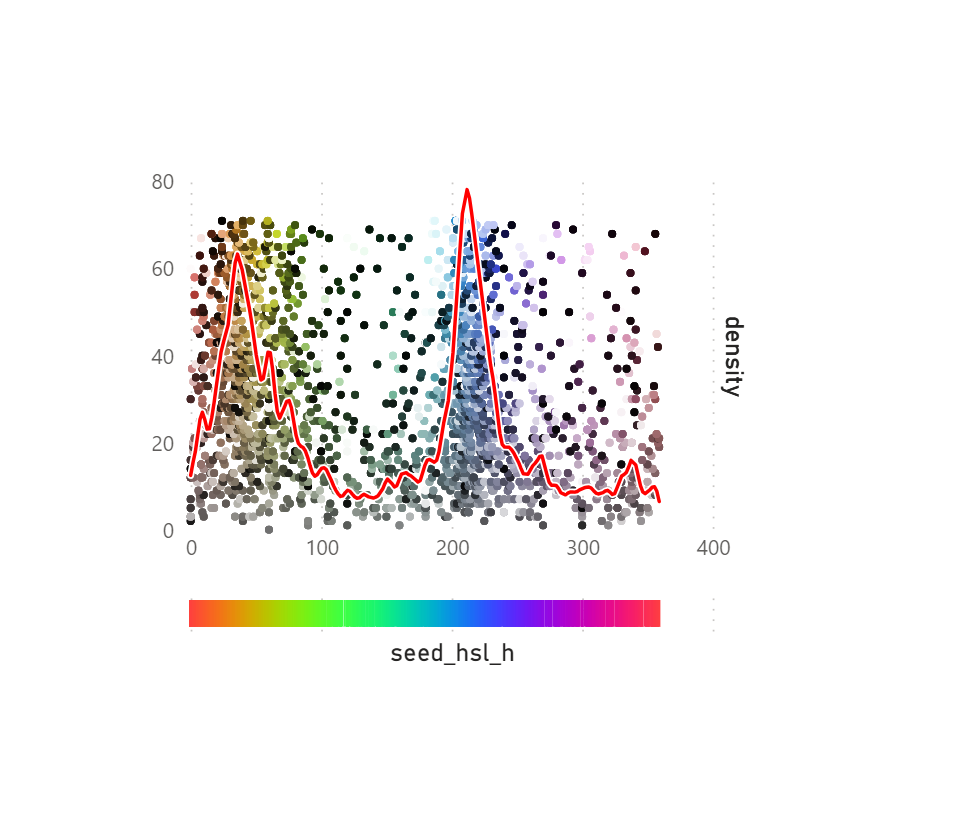
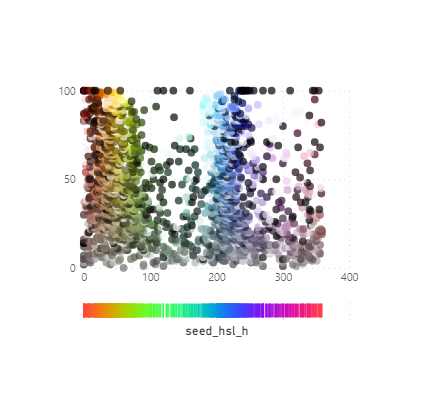
Chart Templates

Templates for various Power BI custom visuals including Deneb and PlotlyJS. Learn how to import a template here. More templates and .pbix files here.

Visual Portfolio, Posts & Image Gallery for WordPress
All
Deneb Templates
PlotlyJS
SVG Templates

Radialwithbarslabels

Deneb Templates

Radial Tree with Bars

bubblehistogram

Deneb Templates

Bubble Histogram

bumpchart4

Deneb Templates

Bump Chart

kpicard

Deneb Templates

KPI Cards

overlaidlabelbar

Deneb Templates

Rounded Bar with Overlaid Labels

gradientareabrushlabels

Deneb Templates

Gradient Area with Brush Labels

Load More Loading More… You’ve reached the end of the list

Post navigation

Previous post

Visualisations

Next post

Ramblings

Recent Posts

  • KPI trend indicators on Core Visuals
  • Visualise Filters Applied
  • Custom path axis with Charticulator
  • Breaking the Rules
  • Convert to Shape

Archives

Categories

EXPLORATIONS IN DATA STORYTELLING WITH POWER BI