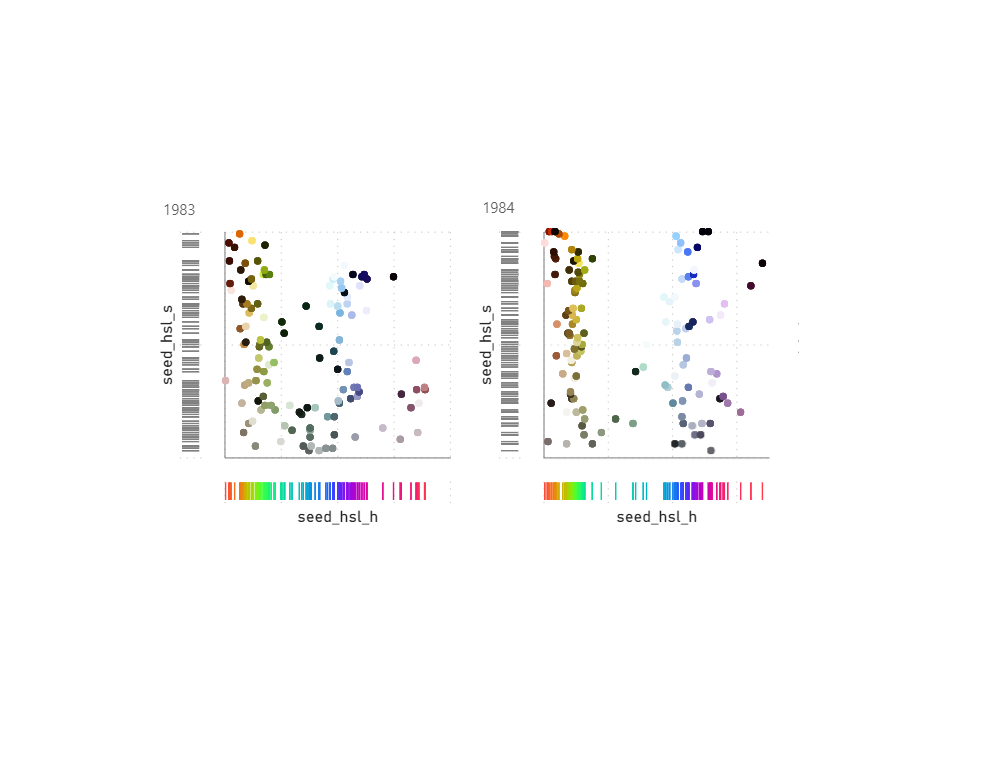
{
  "data": {"name": "dataset"},
  "spec": {
    "bounds": "flush",
    "hconcat": [
      {
        "height": 200,
        "mark": "tick",
        "description": "y-axis dash plot",
        "encoding": {
          "y": {
            "field": "seed_hsl_s",
            "type": "quantitative",
            "axis": {
              "labels": false,
              "domain": false,
              "ticks": false
            }
          },
          "color": {
            "value": "grey",
            "type": "nominal",
            "legend": null
          }
        }
      },
      {
        "bounds": "flush",
        "vconcat": [
          {
            "width": 200,
            "height": 200,
            "mark": "point",
            "description": "dot plot",
            "encoding": {
              "x": {
                "field": "seed_hsl_h",
                "type": "quantitative",
                "axis": {
                  "title": "",
                  "labels": false
                }
              },
              "y": {
                "field": "seed_hsl_s",
                "type": "quantitative",
                "axis": {
                  "title": "",
                  "labels": false
                }
              },
              "color": {
                "field": "SEEDRGBVALUE",
                "type": "nominal",
                "scale": null,
                "legend": null
              }
            }
          },
          {
            "width": 200,
            "mark": "tick",
            "description": "x-axis dash plot",
            "encoding": {
              "x": {
                "field": "seed_hsl_h",
                "type": "quantitative",
                "axis": {
                  "labels": false,
                  "domain": false,
                  "ticks": false
                }
              },
              "color": {
                "field": "seed_hsl_h",
                "type": "nominal",
                "scale": {
                  "scheme": "sinebow"
                },
                "legend": null
              }
            }
          }
        ],
        "resolve": {
          "scale": {
            "color": "independent"
          }
        }
      }
    ]
  },
  "facet": {
    "field": "Year",
    "type": "ordinal",
    "columns": 4
  }
}

