
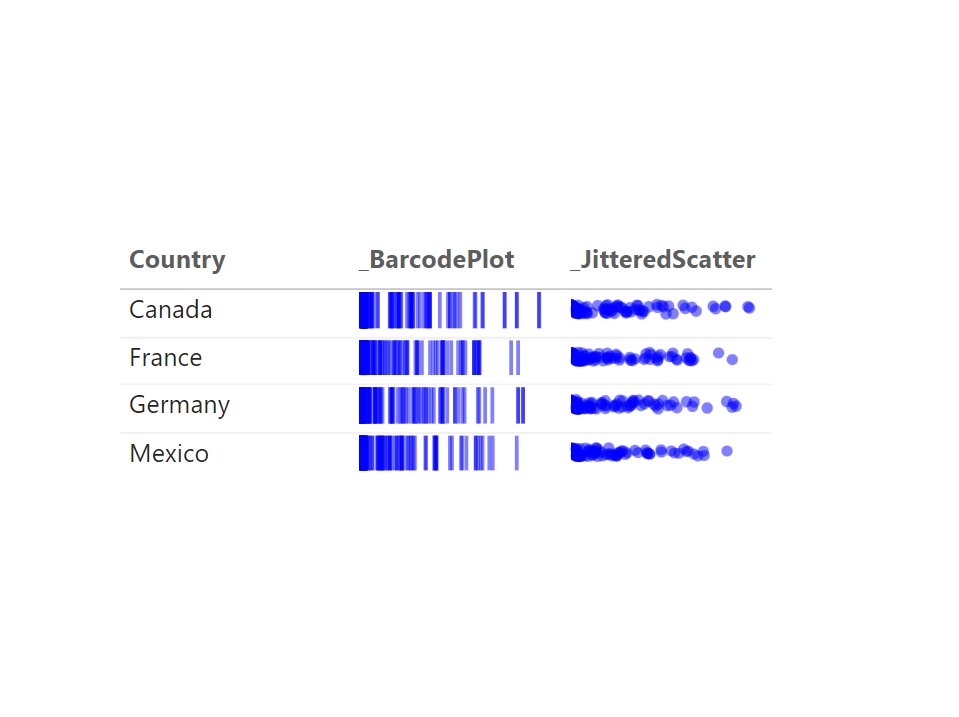
Barcode Plot
_BarcodePlot =
VAR AXISMAXRANGE = CALCULATE(MAX(financials[Gross Sales]), ALL(financials))
VAR AXISMINRANGE = CALCULATE(MIN(financials[Gross Sales]), ALL(financials))
VAR AXISRANGE = AXISMAXRANGE - AXISMINRANGE
VAR SVGWidth = 102
VAR SVGHeight = 20

RETURN
IF(
    HASONEVALUE(financials[Country]),
    "data:image/svg+xml;utf8," &
    "<svg width='" & SVGWidth & "' height='" & SVGHeight & "' xmlns='http://www.w3.org/2000/svg' xmlns:xlink='http://www.w3.org/1999/xlink' overflow='visible'>" &
    CONCATENATEX(
        financials,
        "<line x1='" & (financials[Gross Sales] / AXISMAXRANGE * SVGWidth) & "' y1='1' x2='" & (financials[Gross Sales] / AXISMAXRANGE * SVGWidth) & "' y2='" & SVGHeight & "' stroke='blue' stroke-opacity='0.5' stroke-width='2' />",
        ""
    ) &
    "</svg>",
    BLANK()
)
Jittered Scatter Plot
_JitteredScatterPlot =
VAR _axisMaxRange = CALCULATE(MAX('Service Desk'[First Response Total Minutes]), ALLSELECTED('Service Desk'))
VAR _axisMinRange = CALCULATE(MIN('Service Desk'[First Response Total Minutes]), ALLSELECTED('Service Desk'))
VAR _axisRange = _axisMaxRange - _axisMinRange
VAR _SVGWidth = 100
VAR _SVGHeight = 20
VAR _jitterAmountY = 16 // Adjust this value to control the amount of jitter
VAR _jitterAmountX = 1 // Adjust this value to control the amount of jitter

RETURN
    "data:image/svg+xml;utf8," &
    "<svg viewBox='0 0 100 20' xmlns='http://www.w3.org/2000/svg' xmlns:xlink='http://www.w3.org/1999/xlink' overflow='visible'>" &
    CONCATENATEX(
        'Service Desk',
        VAR _jitterY = RAND() * _jitterAmountY
        VAR _jitterX = RAND() * _jitterAmountX
        RETURN
        "<circle cx='" & ('Service Desk'[First Response Total Minutes] / _axisMaxRange * _SVGWidth + _jitterX) & "' cy='" & (2 + _jitterY) & "' r='2' fill='blue' fill-opacity='0.5' />",
        ""
    ) &
    "</svg>"