
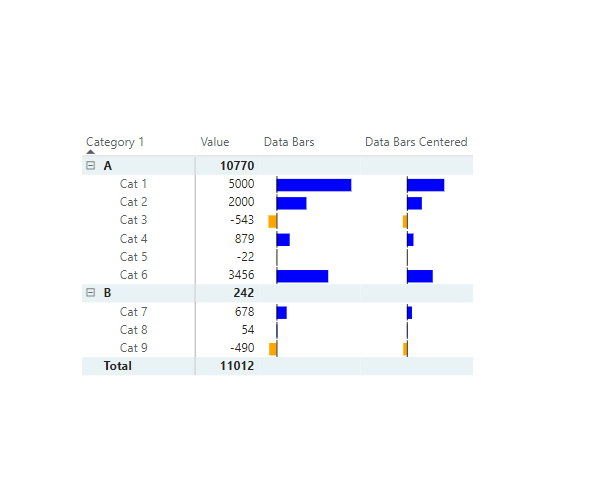
Data Bars not centered (no subtotal)
Data Bars (positive_negative) =
// Developed by Kerry Kolosko
VAR BAR_VALUE = SUM('Table'[Value])  -- Summing the values for the current context
VAR MIN_ALL_VALUE = MINX(ALL('Table'), 'Table'[Value])  -- Getting the minimum value in the table
VAR MAX_ALL_VALUE = MAXX(ALL('Table'), 'Table'[Value])  -- Getting the maximum value in the table
VAR BAR_RANGE = MAX_ALL_VALUE - MIN_ALL_VALUE  -- Calculating the range of values
VAR X_SCALE = DIVIDE( 100, BAR_RANGE) -- Converting to percentage to scale
VAR X_ZERO = X_SCALE * ( 0 - MIN_ALL_VALUE )  -- Calculating the X position of the zero line
VAR BAR_START = IF(BAR_VALUE >= 0, X_ZERO, X_ZERO + (X_SCALE * BAR_VALUE))  -- Starting point of the bar
VAR BAR_WIDTH = ABS(X_SCALE * BAR_VALUE)  -- Width of the bar based on value
VAR PositiveColour = "blue"  -- Colour for positive values (replace with HEX values)
VAR NegativeColour = "orange"  -- Colour for negative values (replace with HEX values)
VAR BarColour = IF(BAR_VALUE >= 0, PositiveColour, NegativeColour)  -- Conditional colour


RETURN
IF(HASONEVALUE('Table'[Category]),  -- Checking if only one value is selected
"data:image/svg+xml;utf8," &
"<svg width='100' height='20' viewBox='-2 -2 102 22' xmlns='http://www.w3.org/2000/svg' xmlns:xlink='http://www.w3.org/1999/xlink' display='block' overflow='visible'>
  <rect id='fill' x='" & BAR_START & "' y='3' rx='0' ry='0' width='" & BAR_WIDTH & "' height='15' fill='" & BarColour & "' fill-opacity='1'>
  </rect>
  <rect id='x-zero' x='" & X_ZERO & "' y='0' rx='0' ry='0' width='1' height='20' fill='black' fill-opacity='1'/>
</svg>"
, BLANK())
Data Bars centered (no subtotal)
Data Bars (positive_negative_centred) =
// Developed by Kerry Kolosko
VAR BAR_VALUE = SUM('Table'[Value])
VAR ABS_MAX = MAXX(ALL('Table'), ABS('Table'[Value]))  -- Highest absolute value
VAR X_ZERO = 50  -- Center of SVG
VAR X_SCALE = DIVIDE(50, ABS_MAX, 0)  -- Scale to 50 units from center

VAR BAR_START = IF(BAR_VALUE >= 0, X_ZERO, X_ZERO + BAR_VALUE * X_SCALE)
VAR BAR_WIDTH = ABS(BAR_VALUE * X_SCALE)

VAR PositiveColour = "blue"
VAR NegativeColour = "orange"
VAR BarColour = IF(BAR_VALUE >= 0, PositiveColour, NegativeColour)

RETURN
IF(
    HASONEVALUE('Table'[Category]),
    "data:image/svg+xml;utf8," &
    "<svg width='100' height='20' viewBox='-2 -2 102 22' xmlns='http://www.w3.org/2000/svg'>
        <rect id='fill' x='" & BAR_START & "' y='3' width='" & BAR_WIDTH & "' height='15' fill='" & BarColour & "' />
        <rect id='x-zero' x='" & X_ZERO & "' y='0' width='1' height='20' fill='black'/>
    </svg>",
    BLANK()
)
Very useful…
Thanks for sharing….