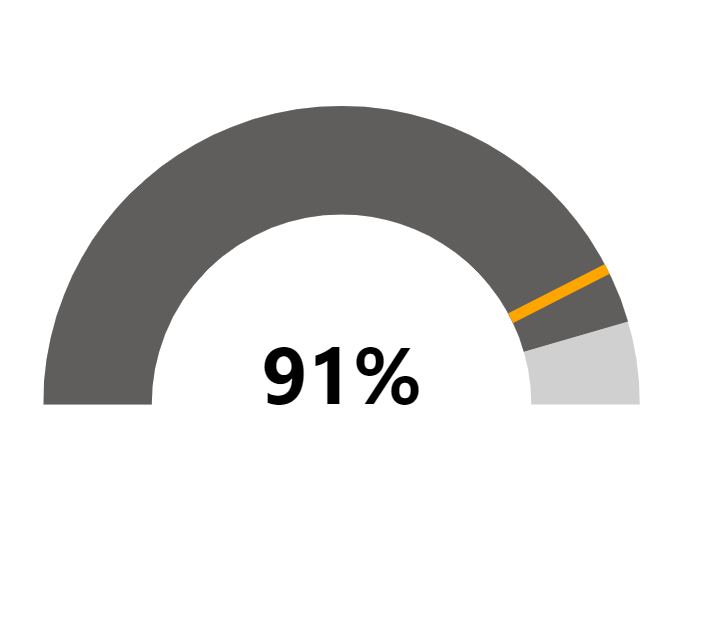
Radial Gauge =
"<div>
    <svg viewBox='0 0 200 100' >
        <path id='track' fill='none' stroke='#D0D0D0' d='M10,55 a45,45 0 1 1 90,0' stroke-width='20' />
        <path id='fill' fill='none' stroke='#605E5C' d='M10,55 a45,45 0 1 1 90,0' stroke-width='20' stroke-dasharray='141.3717' stroke-dashoffset="&""""&(1-'KPI'[KPI Percentage]) * (PI()*45)&""""&">
            <title>Percent: "&'KPI'[KPI Percentage]&"</title>
        </path>
        <path id='target' fill='none' stroke='orange' d='M0,55 L20,55' stroke-width='2' transform='rotate("&MAX('KPI'[Target])*180&" 55 55)'/>
        <text x='55' y='55' font-weight='bold' text-anchor='middle'>"&FORMAT('KPI'[KPI Percentage], "0%")&"</text>
    </svg>
</div>"


I am unable to import this code into Deneb visual. Can you let me know what should be the steps?
Its an SVG template, Deneb uses VegaLite jason. this can work to use as icon on Tables in Power Bi