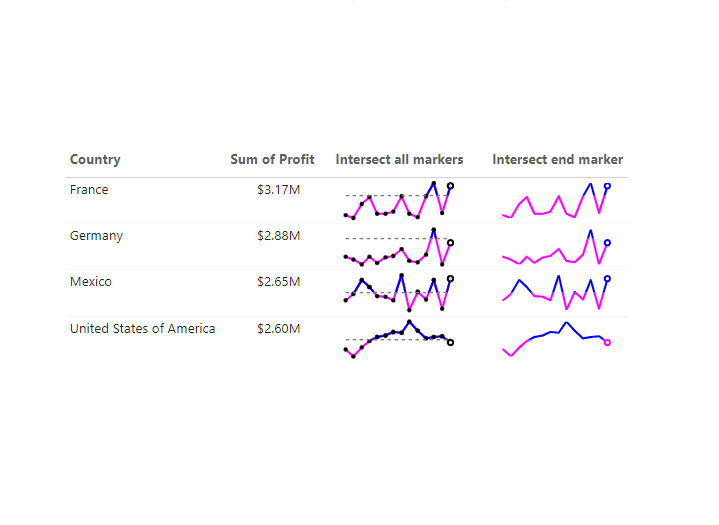
With markers
Sparkline with Intersect =
// developed by Kerry Kolosko
VAR topLineColour = "blue"
VAR bottomLineColour = "magenta"

// "Date" field used in this example along the X axis
VAR XMinDate = MIN(financials[Date])
VAR XMaxDate = MAX(financials[Date])

// Obtain overall min and overall max measure values when evaluated for each date
VAR YMinValue = MINX(Values(financials[Date]),CALCULATE([SUM Profit]))
VAR YMaxValue = MAXX(Values(financials[Date]),CALCULATE([SUM Profit]))

// Build table of X & Y coordinates and fit to 50 x 150 viewbox
VAR SparklineTable = ADDCOLUMNS(
    SUMMARIZE('financials',financials[Date]),
        "X",INT(150 * DIVIDE(financials[Date] - XMinDate, XMaxDate - XMinDate)),
        "Y",INT(50 * DIVIDE([SUM Profit] - YMinValue,YMaxValue - YMinValue)))

// Concatenate X & Y coordinates to build the sparkline
VAR Lines = CONCATENATEX(SparklineTable,[X] & "," & 50-[Y]," ", financials[Date])

// Y-Intersect to divide line colour
VAR lineIntersection = AVERAGEX(Values(financials[Date]),CALCULATE([SUM Profit]))
VAR intersectScaled = INT(50 * DIVIDE(lineIntersection - YMinValue,YMaxValue - YMinValue))

VAR Defs =
"<defs>
    <clipPath id='cut-bottom'>
      <rect x='0' y='0' width='150' height='" & intersectScaled & "' />
    </clipPath>

    <marker id='circle' markerWidth='4' markerHeight='4' refX='2' refY='2' >
      <circle cx='2' cy='2' r='1' fill='black' />
    </marker>

    <marker id='circleLarge' markerWidth='4' markerHeight='4' refX='2' refY='2' >
      <circle cx='2' cy='2' r='1.25' fill='white' stroke='black' />
    </marker>

    <marker id='arrow' markerWidth='3' markerHeight='3' refX='2' refY='2' orient='auto' >
      <path d='M 0 0 L 10 5 L 0 10 z' fill='black' />
    </marker>
</defs>"


// Add to SVG, and verify Data Category is set to Image URL for this measure (for non-table visuals remove IF HASONEVALUE)
VAR SVGImageURL =
IF(
    HASONEVALUE(financials[Country]),
    "data:image/svg+xml;utf8," &
    "<svg xmlns='http://www.w3.org/2000/svg' x='0px' y='0px' viewBox='-5 -5 160 60' >" & Defs &
    "<polyline fill='none' stroke='" & bottomLineColour & "' stroke-width='3' points='" & Lines & "' stroke-linecap='round' stroke-linejoin='round' marker-start='url(#circle)' marker-mid='url(#circle)' marker-end='url(#circleLarge)' />" &
    "<polyline fill='none' stroke='" & topLineColour & "' stroke-width='3' points='" & Lines & "' stroke-linecap='round' stroke-linejoin='round' clip-path='url(#cut-bottom)' marker-start='url(#circle)' marker-mid='url(#circle)' marker-end='url(#circleLarge)' />" &
    "<line x1='0' y1='" & intersectScaled & "' x2='150' y2='" & intersectScaled & "' stroke ='grey' stroke-width ='2' stroke-dasharray='5,5' />" &
    "</svg>",
    BLANK()
)

RETURN SVGImageURL
With end marker only
Sparkline with Intersect end marker =
// developed by Kerry Kolosko
VAR topLineColour = "blue"
VAR bottomLineColour = "magenta"

// "Date" field used in this example along the X axis
VAR XMinDate = MIN(financials[Date])
VAR XMaxDate = MAX(financials[Date])

// Obtain overall min and overall max measure values when evaluated for each date
VAR YMinValue = MINX(Values(financials[Date]),CALCULATE([SUM Profit]))
VAR YMaxValue = MAXX(Values(financials[Date]),CALCULATE([SUM Profit]))

// Build table of X & Y coordinates and fit to 50 x 150 viewbox
VAR SparklineTable = ADDCOLUMNS(
    SUMMARIZE('financials',financials[Date]),
        "X",INT(150 * DIVIDE(financials[Date] - XMinDate, XMaxDate - XMinDate)),
        "Y",INT(50 * DIVIDE([SUM Profit] - YMinValue,YMaxValue - YMinValue)))

// Concatenate X & Y coordinates to build the sparkline
VAR Lines = CONCATENATEX(SparklineTable,[X] & "," & 50-[Y]," ", financials[Date])

// Last data points on the line
VAR LastSparkYValue = MAXX( FILTER(SparklineTable, financials[Date] = XMaxDate), [Y])
VAR LastSparkXValue = MAXX( FILTER(SparklineTable, financials[Date] = XMaxDate), [X])

// Y-Intersect to divide line colour
VAR lineIntersection = AVERAGEX(Values(financials[Date]),CALCULATE([SUM Profit]))
VAR intersectScaled = INT(50 * DIVIDE(lineIntersection - YMinValue,YMaxValue - YMinValue))

VAR Defs =
"<defs>
    <clipPath id='cut-bottom'>
      <rect x='-5' y='0' width='165' height='" & intersectScaled & "' />
    </clipPath>
    <clipPath id='cut-top'>
      <rect x='-5' y='" & intersectScaled & "' width='165' height='" & 50-intersectScaled & "' />
    </clipPath>
    <marker id='circleLarge' markerWidth='4' markerHeight='4' refX='2' refY='2' >
      <circle cx='2' cy='2' r='1.25' fill='white' stroke='"&IF(LastSparkYValue<intersectScaled,bottomLineColour,topLineColour)&"' />
    </marker>
</defs>"


// Add to SVG, and verify Data Category is set to Image URL for this measure (for non-table visuals remove IF HASONEVALUE)
VAR SVGImageURL =
IF(
    HASONEVALUE(financials[Country]),
    "data:image/svg+xml;utf8," &
    "<svg xmlns='http://www.w3.org/2000/svg' x='0px' y='0px' viewBox='-5 -5 160 60' >" & Defs &
    "<polyline fill='none' stroke='" & bottomLineColour & "' stroke-width='3' points='" & Lines & "' stroke-linecap='round' stroke-linejoin='round' clip-path='url(#cut-top)' marker-end='url(#circleLarge)' />" &
    "<polyline fill='none' stroke='" & topLineColour & "' stroke-width='3' points='" & Lines & "' stroke-linecap='round' stroke-linejoin='round' clip-path='url(#cut-bottom)' marker-end='url(#circleLarge)' />" &
//    "<line x1='0' y1='" & intersectScaled & "' x2='150' y2='" & intersectScaled & "' stroke ='grey' stroke-width ='2' stroke-dasharray='5,5' />" &
    "</svg>",
    BLANK()
)

RETURN SVGImageURL