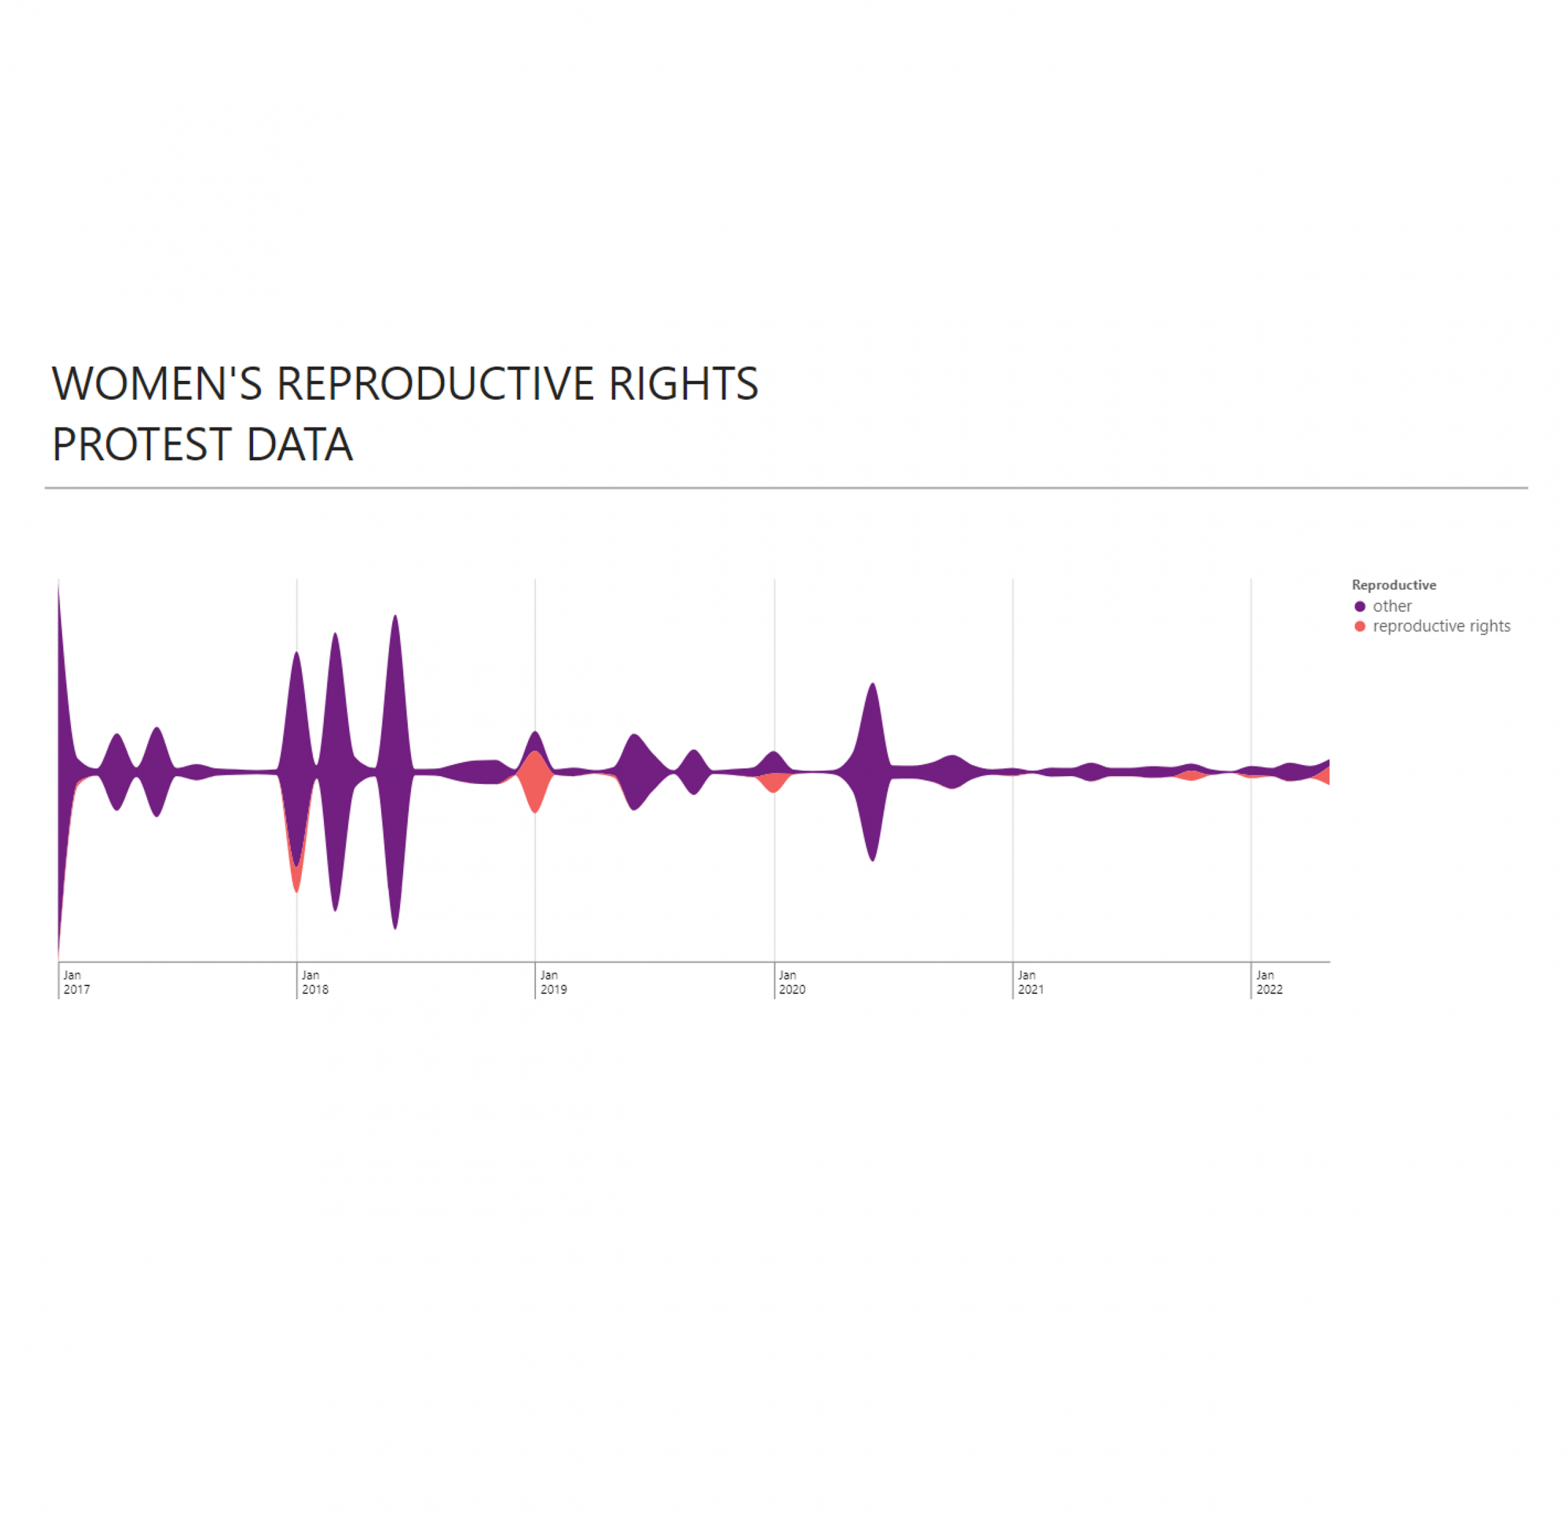
{
  "$schema": "https://vega.github.io/schema/vega-lite/v5.json",
  "usermeta": {
    "deneb": {
      "build": "1.2.0.1",
      "metaVersion": 1,
      "provider": "vegaLite",
      "providerVersion": "5.2.0"
    },
    "interactivity": {
      "tooltip": true,
      "contextMenu": true,
      "selection": false,
      "highlight": false,
      "dataPointLimit": 50
    },
    "information": {
      "name": "Stream Graph",
      "description": "[No Description Provided]",
      "author": "Kerry Kolosko",
      "uuid": "66c13c3a-230e-4788-a481-5ab01d52d377",
      "generated": "2022-05-22T02:59:08.727Z"
    },
    "dataset": [
      {
        "key": "__0__",
        "name": "date",
        "description": "",
        "type": "dateTime",
        "kind": "column"
      },
      {
        "key": "__1__",
        "name": "category",
        "description": "",
        "type": "text",
        "kind": "column"
      },
      {
        "key": "__2__",
        "name": "size",
        "description": "",
        "type": "numeric",
        "kind": "measure"
      }
    ]
  },
  "config": {
    "autosize": {
      "type": "fit",
      "contains": "padding"
    },
    "view": {"stroke": "transparent"},
    "font": "Segoe UI",
    "arc": {},
    "area": {
      "line": false,
      "opacity": 1
    },
    "bar": {},
    "line": {
      "strokeWidth": 3,
      "strokeCap": "round",
      "strokeJoin": "round"
    },
    "path": {},
    "point": {
      "filled": true,
      "size": 75
    },
    "rect": {},
    "shape": {},
    "symbol": {
      "strokeWidth": 1.5,
      "size": 50
    },
    "text": {
      "font": "Segoe UI",
      "fontSize": 12,
      "fill": "#605E5C"
    },
    "legend": {
      "titleFont": "Segoe UI",
      "titleFontWeight": "bold",
      "titleColor": "#605E5C",
      "labelFont": "Segoe UI",
      "labelFontSize": 13.333333333333332,
      "labelColor": "#605E5C",
      "symbolType": "circle",
      "symbolSize": 75
    }
  },
  "data": {"name": "dataset"},
  "mark": {
    "type": "area",
    "interpolate": "monotone"
  },
  "encoding": {
    "x": {
      "timeUnit": "yearmonth",
      "field": "__0__",
      "type": "temporal",
      "axis": {
        "title": "",
        "tickCount": 8,
        "labelAlign": "left",
        "labelExpr": "[timeFormat(datum.value, '%b'), timeFormat(datum.value, '%m') == '01' ? timeFormat(datum.value, '%Y') : '']",
        "labelOffset": 4,
        "labelPadding": -24,
        "tickSize": 30,
        "gridDash": {
          "condition": {
            "test": {
              "field": "value",
              "timeUnit": "month",
              "equal": 1
            },
            "value": []
          },
          "value": [2, 2]
        },
        "tickDash": {
          "condition": {
            "test": {
              "field": "value",
              "timeUnit": "month",
              "equal": 1
            },
            "value": []
          },
          "value": [2, 2]
        }
      }
    },
    "y": {
      "aggregate": "sum",
      "field": "__2__",
      "axis": null,
      "stack": "center"
    },
    "color": {
      "field": "__1__",
      "scale": {"scheme": "magma"}
    }
  }
}

