
For Standalone Deneb only (not Certified AppSource Deneb)
Inspiration : https://observablehq.com/@vega/vega-lite-spike-map
{
"$schema": "https://vega.github.io/schema/vega-lite/v5.json",
"usermeta": {
"deneb": {
"build": "1.2.0.20220421#9062c55",
"metaVersion": 1,
"provider": "vegaLite",
"providerVersion": "5.2.0"
},
"interactivity": {
"tooltip": true,
"contextMenu": true,
"selection": false,
"highlight": false,
"dataPointLimit": 50
},
"information": {
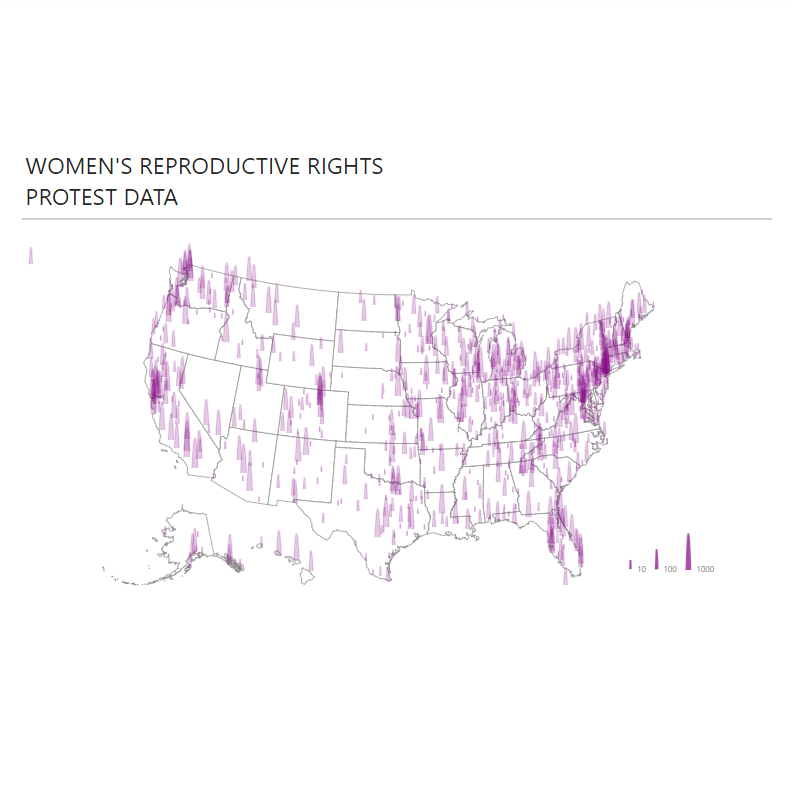
"name": "Spike Map",
"description": "For Standalone Deneb Only",
"author": "Kerry Kolosko",
"uuid": "be3a25e1-f14b-4e0d-9400-0604a5ff2af3",
"generated": "2022-05-23T13:03:39.024Z"
},
"dataset": [
{
"key": "__0__",
"name": "index",
"description": "grain",
"type": "text",
"kind": "column"
},
{
"key": "__1__",
"name": "size",
"description": "scale of spikes",
"type": "numeric",
"kind": "measure"
},
{
"key": "__2__",
"name": "lat",
"description": "latitude",
"type": "numeric",
"kind": "measure"
},
{
"key": "__3__",
"name": "lon",
"description": "longitude",
"type": "numeric",
"kind": "measure"
}
]
},
"config": {
"autosize": {
"type": "fit",
"contains": "padding"
},
"view": {"stroke": "transparent"},
"font": "Segoe UI",
"arc": {},
"area": {
"line": true,
"opacity": 0.6
},
"bar": {},
"line": {
"strokeWidth": 3,
"strokeCap": "round",
"strokeJoin": "round"
},
"path": {},
"point": {
"filled": true,
"size": 75
},
"rect": {},
"shape": {},
"symbol": {
"strokeWidth": 1.5,
"size": 50
},
"text": {
"font": "Segoe UI",
"fontSize": 12,
"fill": "#605E5C"
},
"axis": {
"ticks": false,
"grid": false,
"domain": false,
"labelColor": "#605E5C",
"labelFontSize": 12,
"titleFont": "wf_standard-font, helvetica, arial, sans-serif",
"titleColor": "#252423",
"titleFontSize": 16,
"titleFontWeight": "normal"
},
"axisQuantitative": {
"tickCount": 3,
"grid": true,
"gridColor": "#C8C6C4",
"gridDash": [1, 5],
"labelFlush": false
},
"axisBand": {"tickExtra": true},
"axisX": {"labelPadding": 5},
"axisY": {"labelPadding": 10},
"header": {
"titleFont": "wf_standard-font, helvetica, arial, sans-serif",
"titleFontSize": 16,
"titleColor": "#252423",
"labelFont": "Segoe UI",
"labelFontSize": 13.333333333333332,
"labelColor": "#605E5C"
},
"legend": {
"titleFont": "Segoe UI",
"titleFontWeight": "bold",
"titleColor": "#605E5C",
"labelFont": "Segoe UI",
"labelFontSize": 13.333333333333332,
"labelColor": "#605E5C",
"symbolType": "M-0.5 0 Q0 -15 0.5 0",
"direction": "horizontal",
"orient": "bottom-right",
"values": [100, 500, 1000],
"ticks": 3,
"symbolSize": 75
}
},
"data": {"name": "dataset"},
"layer": [
{
"data": {
"url": "https://raw.githubusercontent.com/vega/vega/main/docs/data/us-10m.json",
"format": {
"type": "topojson",
"feature": "states"
}
},
"projection": {
"type": "albersUSA"
},
"mark": {
"type": "geoshape",
"fill": "white",
"stroke": "grey"
}
},
{
"data": {"name": "dataset"},
"projection": {
"type": "albersUSA"
},
"mark": {
"type": "point",
"tooltip": true,
"filled": true,
"fillOpacity": 0.3,
"stroke": "purple",
"strokeWidth": 0.5
},
"encoding": {
"longitude": {
"field": "__3__",
"type": "quantitative"
},
"latitude": {
"field": "__2__",
"type": "quantitative"
},
"size": {
"field": "__1__",
"legend": {
"values": [10, 100, 1000],
"ticks": 3,
"title": ""
}
},
"color": {"value": "purple"},
"scale": {"type": "linear"},
"shape": {
"datum": "spike",
"scale": {
"domain": ["spike"],
"range": [
"M-0.5 0 Q0 -10 0.5 0"
]
},
"legend": false
}
}
}
]
}