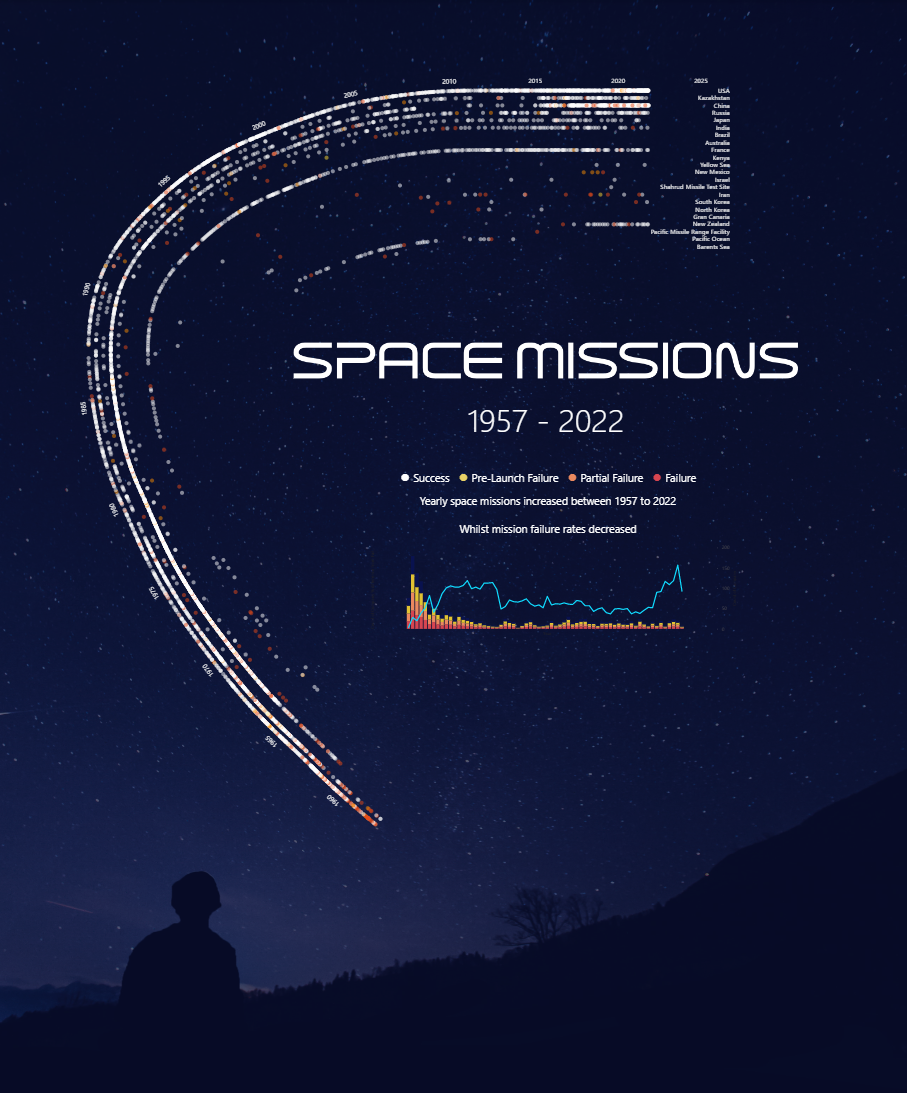
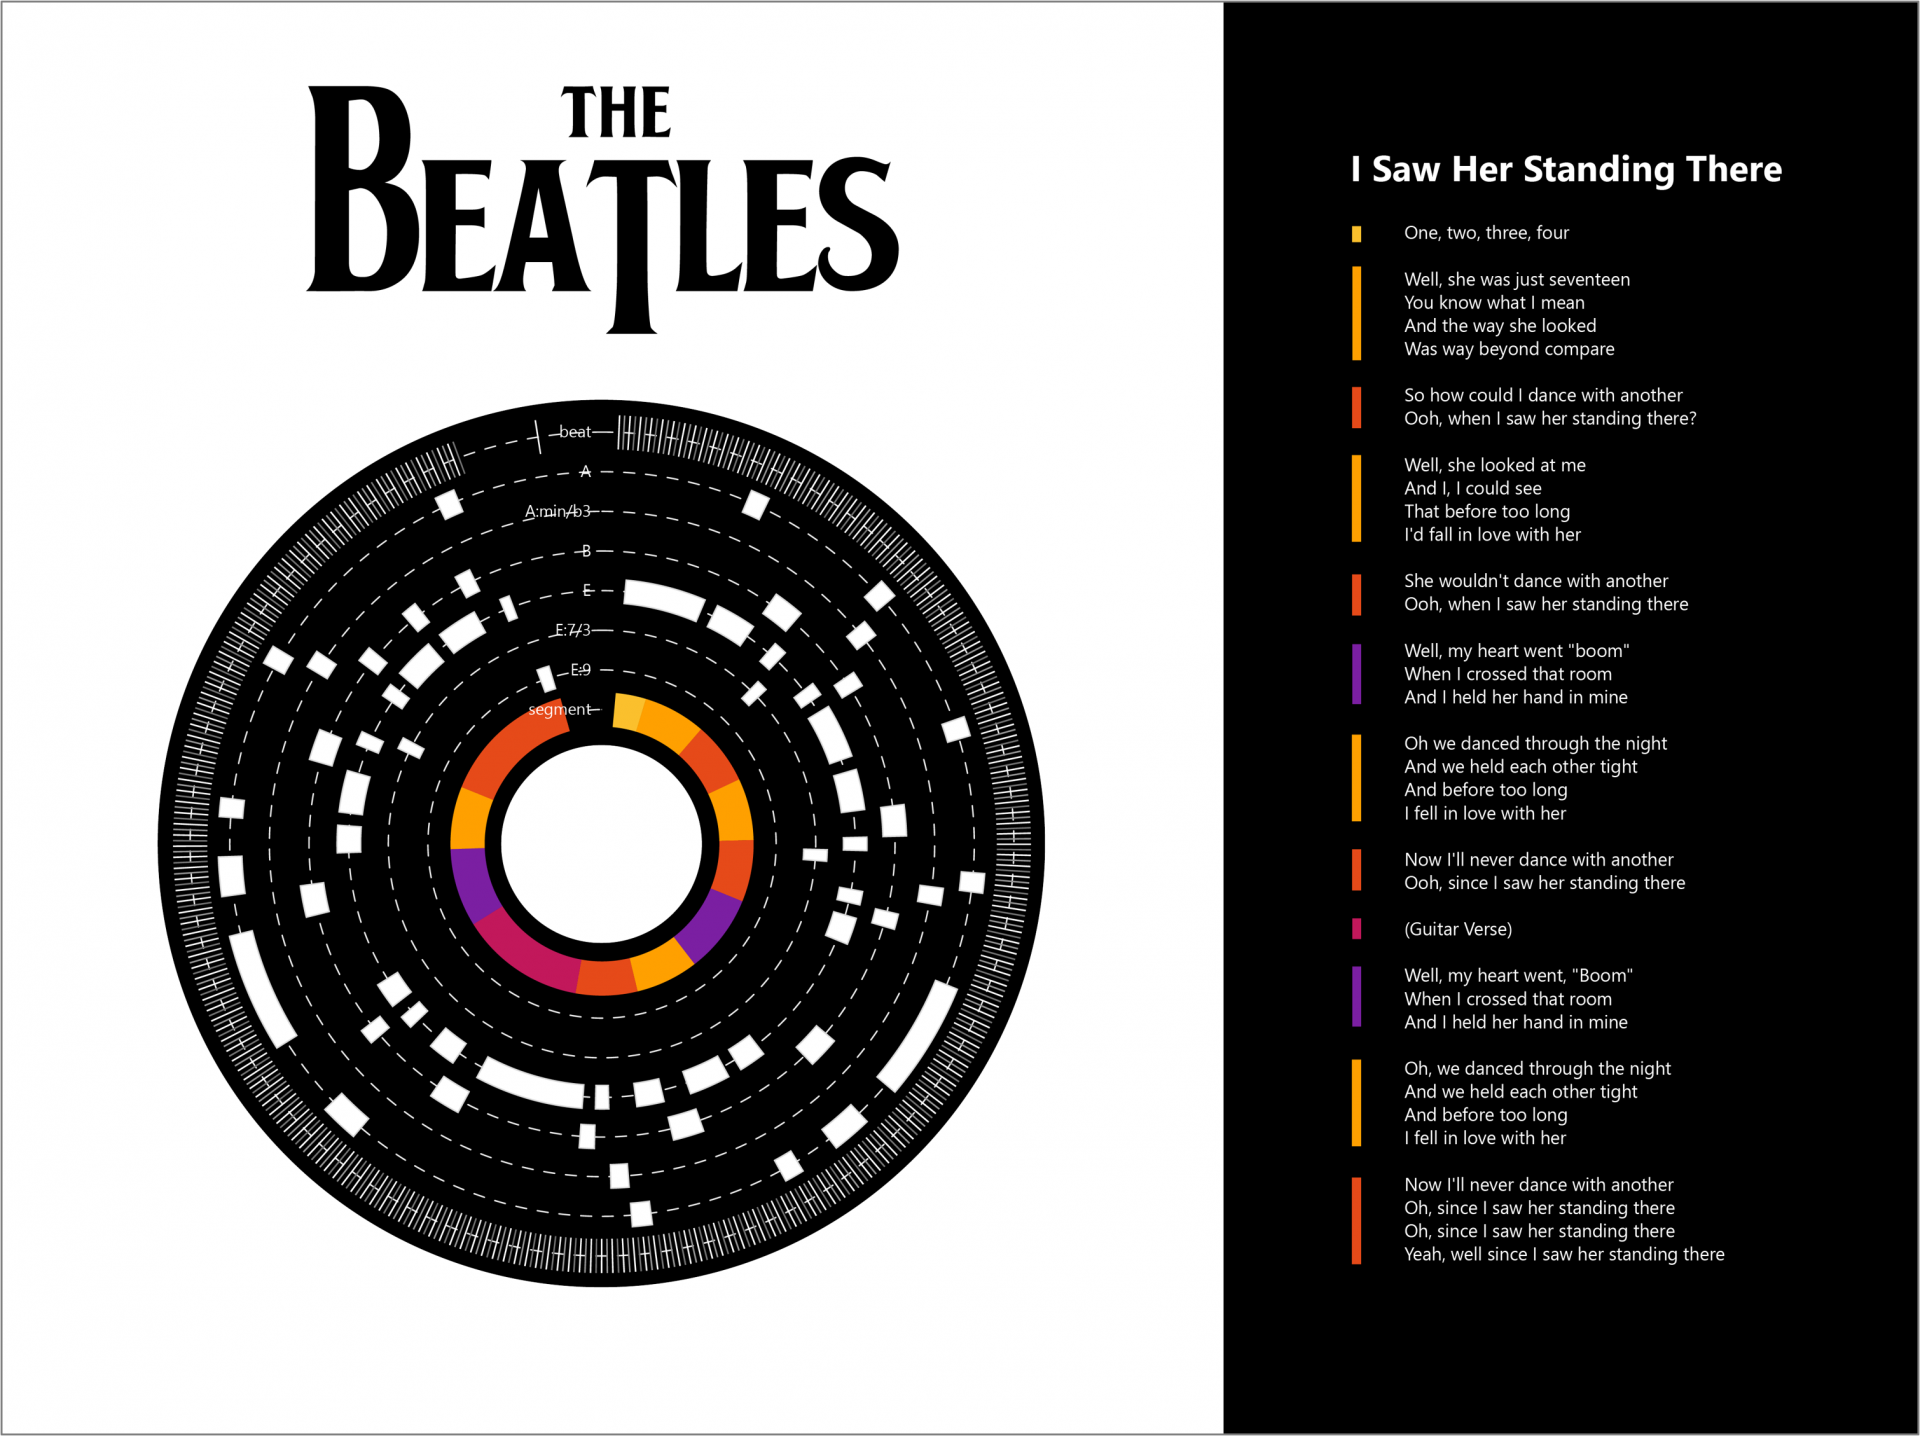
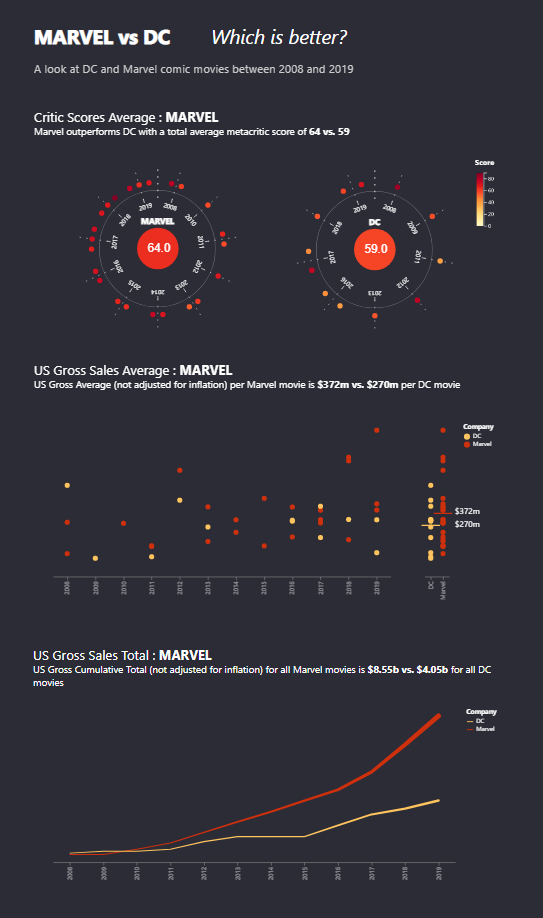
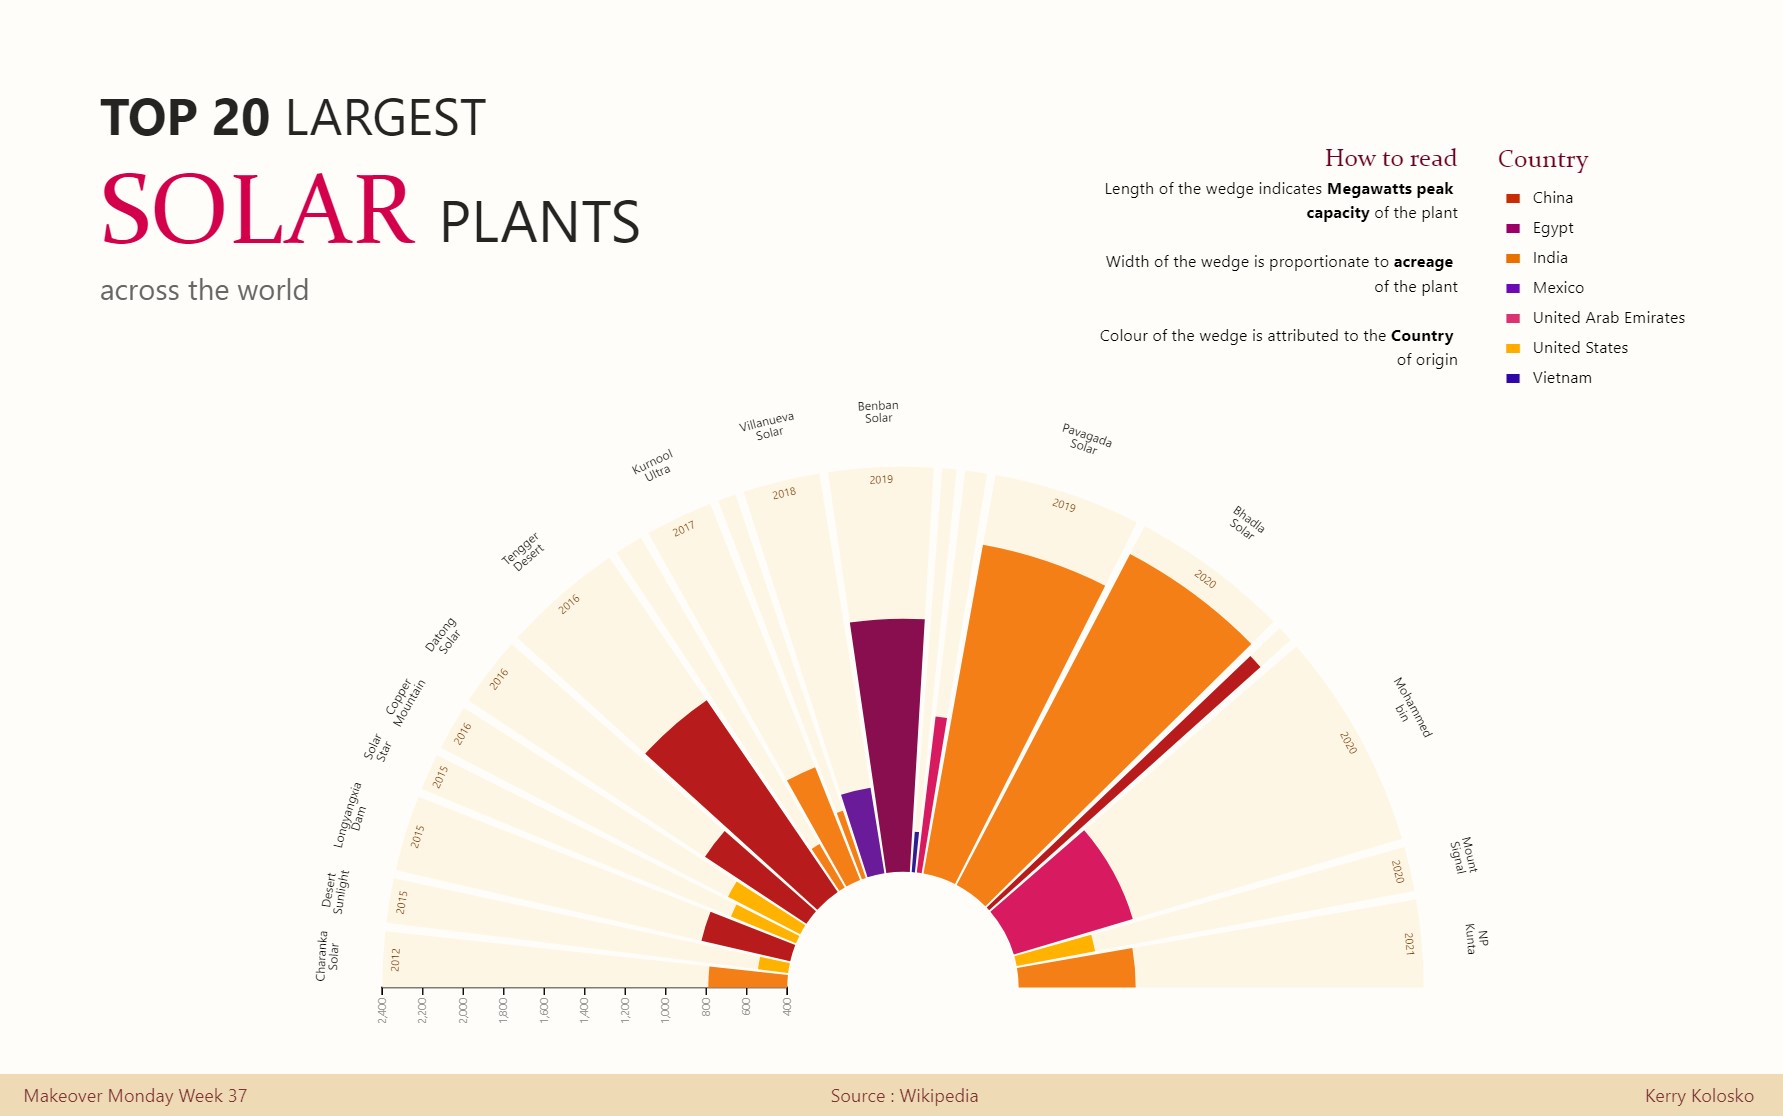
Skip to content
EXPLORATIONS IN DATA STORYTELLING WITH POWER BI

EXPLORATIONS IN DATA STORYTELLING WITH POWER BI

  • Home
  • Visualisations
  • Templates
    • Deneb Templates
    • SVG Templates
    • PlotlyJS Templates
  • About
  • Shop
  • LinkedIn
  • Twitter
  • YouTube
  • Instagram

Visualisations

Find more

Visual Portfolio, Posts & Image Gallery for WordPress
Charticulator

Space Missions

Beatles Data Visualisation
Charticulator

The Beatles

Charticulator
Deneb

Marvel vs DC

Makeover Monday Week 37
Charticulator

Largest Solar Plants

Recent Posts

  • Folding (Unpivot Data) with Vega-Lite & Deneb
  • Earworms and T-Shirts
  • Smoothed lines with Core Visuals vs. Deneb
  • Drop the Drop Shadows!
  • Adding sparklines to New Card Visual

Archives

Categories

EXPLORATIONS IN DATA STORYTELLING WITH POWER BI