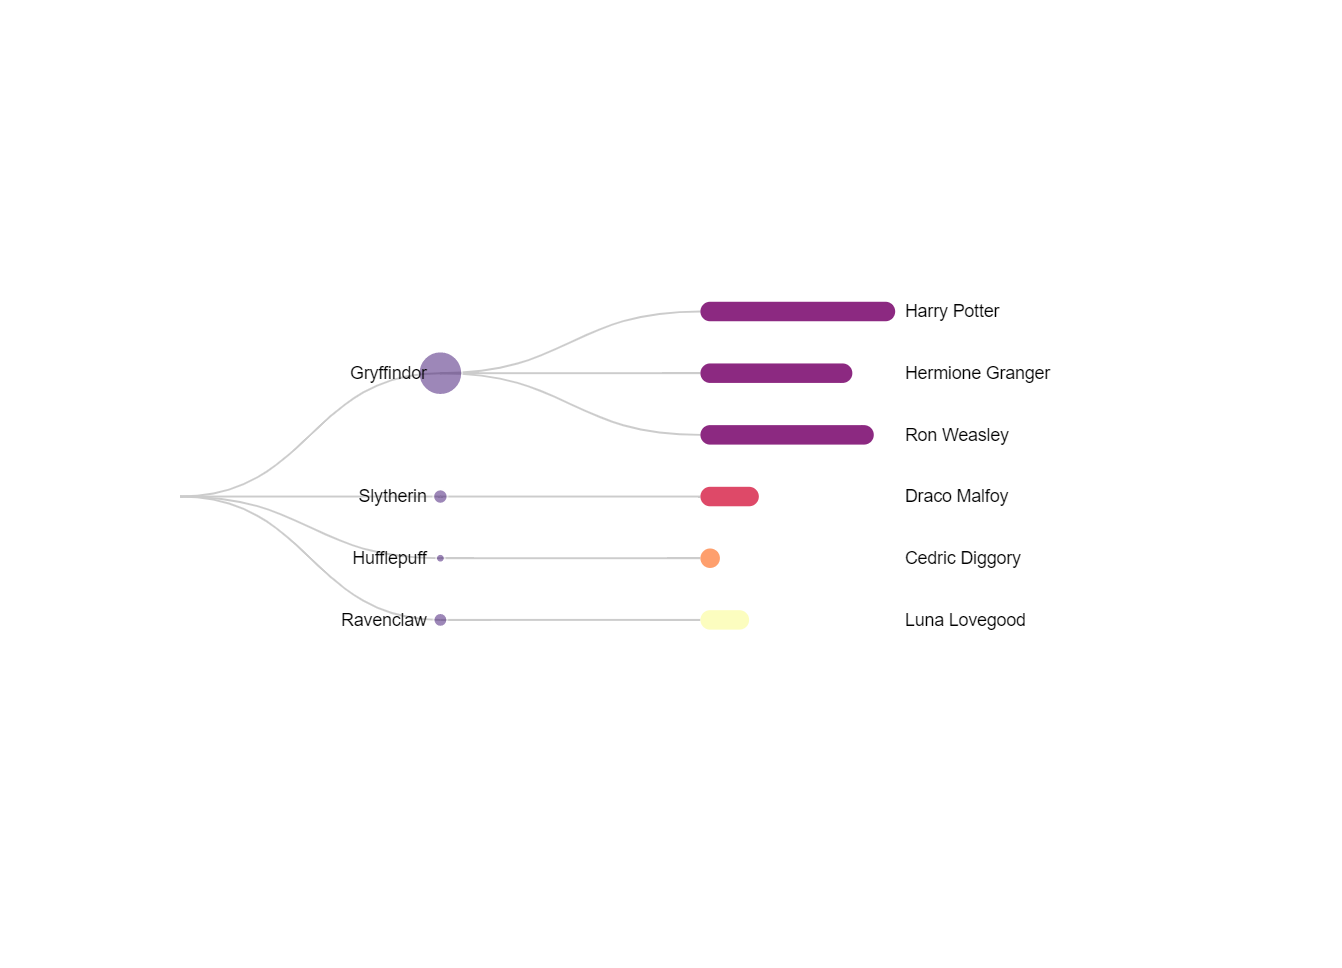
{
  "$schema": "https://vega.github.io/schema/vega/v5.json",
  "usermeta": {
    "deneb": {
      "build": "1.1.0.0",
      "metaVersion": 1,
      "provider": "vega",
      "providerVersion": "5.21.0"
    },
    "interactivity": {
      "tooltip": true,
      "contextMenu": true,
      "selection": false,
      "dataPointLimit": 50
    },
    "information": {
      "name": "Tidy Tree Area Bar",
      "description": "[No Description Provided]",
      "author": "Kerry Kolosko",
      "uuid": "133a8bbd-5566-4896-bcca-13309436123d",
      "generated": "2022-04-10T07:01:45.545Z"
    },
    "dataset": [
      {
        "key": "__0__",
        "name": "id",
        "description": "",
        "type": "numeric",
        "kind": "column"
      },
      {
        "key": "__1__",
        "name": "label",
        "description": "",
        "type": "text",
        "kind": "column"
      },
      {
        "key": "__2__",
        "name": "Width",
        "description": "",
        "type": "numeric",
        "kind": "column"
      },
      {
        "key": "__3__",
        "name": "Size",
        "description": "",
        "type": "text",
        "kind": "column"
      },
      {
        "key": "__4__",
        "name": "Children",
        "description": "",
        "type": "numeric",
        "kind": "measure"
      },
      {
        "key": "__5__",
        "name": "parentid",
        "description": "",
        "type": "numeric",
        "kind": "measure"
      }
    ]
  },
  "config": {
    "autosize": {
      "type": "fit",
      "contains": "padding"
    }
  },
  "data": [
    {
      "name": "dataset",
      "transform": [
        {
          "key": "__0__",
          "parentKey": "__5__",
          "type": "stratify"
        },
        {
          "method": "tidy",
          "separation": false,
          "as": [
            "y",
            "x",
            "depth",
            "__4__",
            "__2__"
          ],
          "size": [
            {"signal": "height"},
            {"signal": "width - 100"}
          ],
          "type": "tree"
        }
      ]
    },
    {
      "name": "links",
      "source": "dataset",
      "transform": [
        {"type": "treelinks"},
        {
          "shape": "diagonal",
          "type": "linkpath",
          "orient": "horizontal"
        }
      ]
    },
    {
      "name": "circles",
      "source": "dataset",
      "transform": [
        {
          "type": "filter",
          "expr": "datum['__4__'] > 0"
        }
      ]
    }
  ],
  "height": 200,
  "padding": 5,
  "marks": [
    {
      "encode": {
        "update": {
          "stroke": {"value": "#ccc"},
          "path": {"field": "path"}
        }
      },
      "from": {"data": "links"},
      "type": "path"
    },
    {
      "encode": {
        "update": {
          "x": {"field": "x"},
          "fill": {
            "field": "__5__",
            "scale": "color"
          },
          "y": {"field": "y"}
        },
        "enter": {
          "stroke": {"value": "#fff"},
          "size": {
            "field": "__3__",
            "mult": 5
          },
          "opacity": {"value": 0.5}
        }
      },
      "from": {"data": "circles"},
      "type": "symbol"
    },
    {
      "encode": {
        "update": {
          "align": {
            "signal": "datum['__4__'] ? 'right' : 'left'"
          },
          "x": {"field": "x"},
          "dx": {
            "signal": "datum['__4__'] ? -7 : 105"
          },
          "opacity": {"value": 1},
          "y": {"field": "y"}
        },
        "enter": {
          "fontSize": {"value": 9},
          "text": {"field": "__1__"},
          "baseline": {
            "value": "middle"
          }
        }
      },
      "from": {"data": "dataset"},
      "type": "text"
    },
    {
      "type": "rect",
      "from": {"data": "dataset"},
      "encode": {
        "enter": {
          "x": {
            "field": "x",
            "offset": -5
          },
          "y": {
            "field": "y",
            "offset": -5
          }
        },
        "update": {
          "x": {"field": "x"},
          "width": {"field": "__2__"},
          "fill": {
            "scale": "color",
            "field": "__5__"
          },
          "height": {"value": 10},
          "cornerRadius": {"value": 5}
        }
      }
    }
  ],
  "scales": [
    {
      "name": "color",
      "zero": true,
      "range": {"scheme": "magma"},
      "domain": {
        "data": "dataset",
        "field": "__5__"
      },
      "type": "linear"
    }
  ]
}


Hello,
I don’t seem to be able to get Deneb to display any type of chart that contains hierarchical data. Can you help me out by providing the datatable you used for this, so that I can import it into power Bi and give it a try?
Because I mange to do it with data as a JSON indicating ID and ParentID, but I cannot do it from the power bi dataset. Thanks 😀