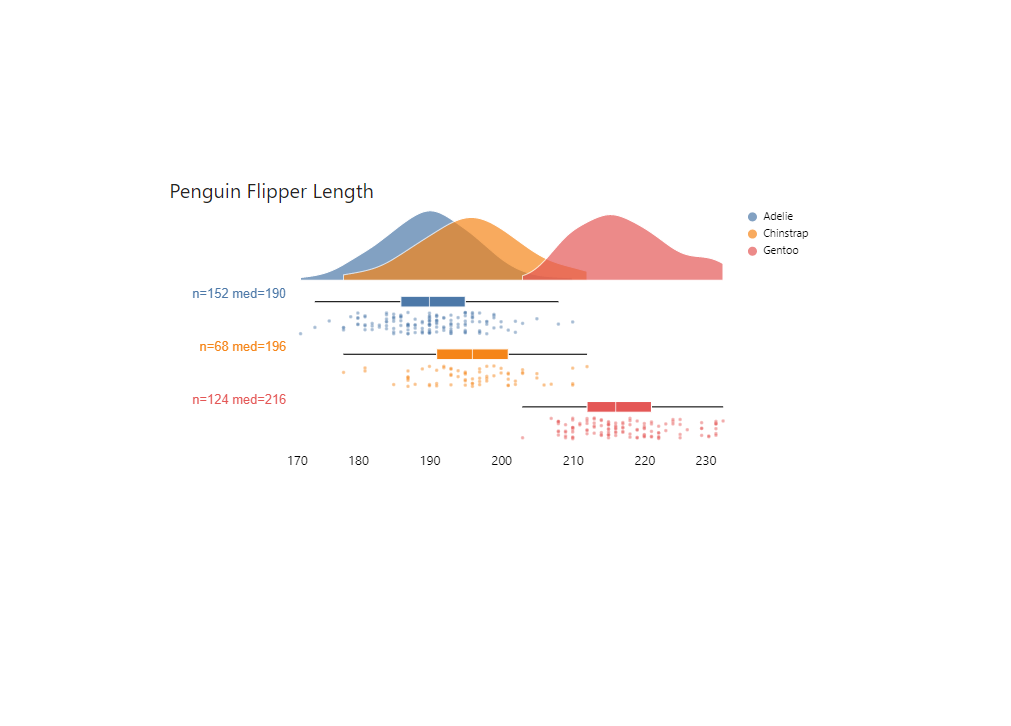
{
  "$schema": "https://vega.github.io/schema/vega-lite/v5.json",
  "usermeta": {
    "deneb": {
      "build": "1.1.0.0",
      "metaVersion": 1,
      "provider": "vegaLite",
      "providerVersion": "5.2.0"
    },
    "interactivity": {
      "tooltip": true,
      "contextMenu": true,
      "selection": false,
      "dataPointLimit": 50
    },
    "information": {
      "name": "Rainclouds Labelled",
      "description": "[No Description Provided]",
      "author": "Kerry Kolosko",
      "uuid": "12d6be82-312e-4ec1-8c07-a2f9a16fcf5a",
      "generated": "2022-04-10T09:18:51.433Z"
    },
    "dataset": [
      {
        "key": "__0__",
        "name": "Category",
        "description": "",
        "type": "text",
        "kind": "column"
      },
      {
        "key": "__1__",
        "name": "Index",
        "description": "",
        "type": "numeric",
        "kind": "column"
      },
      {
        "key": "__2__",
        "name": "Measure",
        "description": "",
        "type": "numeric",
        "kind": "measure"
      },
      {
        "key": "__3__",
        "name": "Count",
        "description": "",
        "type": "text",
        "kind": "measure"
      }
    ]
  },
  "config": {
    "padding": 0,
    "view": {"stroke": "transparent"},
    "facet": {"spacing": 2},
    "header": {
      "title": null,
      "labelColor": "white"
    },
    "font": "Segoe UI",
    "area": {
      "color": "#eaeaea",
      "interpolate": "cardinal",
      "stroke": "white"
    },
    "point": {
      "size": 10,
      "opacity": 0.5,
      "color": "#eaeaea",
      "stroke": "white",
      "strokeWidth": 0.25,
      "filled": true
    },
    "axis": {
      "domain": false,
      "grid": false,
      "labelFontSize": 12,
      "ticks": false,
      "tickCount": 5,
      "titleFontSize": 12,
      "titleFontWeight": 400,
      "titleColor": "#605E5C",
      "offset": 10
    },
    "boxplot": {
      "size": 10,
      "outliers": false,
      "box": {
        "color": "#eaeaea",
        "stroke": "white",
        "strokeWidth": 1
      },
      "rule": {"stroke": "black"},
      "median": {"color": "white"}
    },
    "axisY": {"disable": true},
    "legend": {"title": null}
  },
  "data": {"name": "dataset"},
  "bounds": "flush",
  "spacing": 15,
  "vconcat": [
    {
      "height": 65,
      "width": 400,
      "mark": {
        "type": "area",
        "opacity": 0.7
      },
      "transform": [
        {
          "density": "__2__",
          "groupby": ["__0__"],
          "bandwidth": 0
        }
      ],
      "encoding": {
        "x": {
          "field": "value",
          "type": "quantitative",
          "scale": {
            "domain": [170, 230]
          },
          "axis": false,
          "title": ""
        },
        "y": {
          "field": "density",
          "type": "quantitative"
        },
        "color": {
          "field": "__0__",
          "type": "nominal"
        }
      }
    },
    {
      "facet": {
        "row": {"field": "__0__"}
      },
      "transform": [
        {
          "calculate": "random()",
          "as": "Jitter"
        }
      ],
      "spec": {
        "resolve": {
          "scale": {"y": "independent"}
        },
        "height": 10,
        "width": 400,
        "layer": [
          {"mark": {"type": "boxplot"}},
          {
            "mark": {
              "type": "point",
              "tooltip": true
            },
            "encoding": {
              "y": {
                "field": "Jitter",
                "type": "quantitative",
                "scale": {
                  "range": [35, 15]
                }
              }
            }
          },
          {
            "mark": {
              "type": "text",
              "dx": 0,
              "dy": 0,
              "xOffset": 0,
              "yOffset": 0,
              "angle": 0,
              "color": "black",
              "align": "right",
              "baseline": "bottom",
              "font": "sans-serif",
              "fontSize": 12,
              "fontStyle": "normal",
              "fontWeight": "normal",
              "limit": 0
            },
            "encoding": {
              "x": {
                "aggregate": {
                  "argmax": "__2__"
                },
                "datum": 170
              },
              "text": {"field": "__3__"}
            }
          }
        ],
        "encoding": {
          "x": {
            "field": "__2__",
            "type": "quantitative",
            "axis": {"title": ""},
            "scale": {
              "domain": [170, 230]
            }
          },
          "color": {
            "field": "__0__",
            "type": "nominal"
          }
        }
      }
    }
  ]
}


would you please explain how meaning of data set in key __2__ and key __3__? I would appreciated if you can give basic instruction e.g. included structure of data set?
They are templated values, when you import as template, you will be prompted to replace these with Field Names