Skip to content
EXPLORATIONS IN DATA STORYTELLING WITH POWER BI

EXPLORATIONS IN DATA STORYTELLING WITH POWER BI

  • Home
  • Visualisations
  • Templates
    • Deneb Templates
    • SVG Templates
    • PlotlyJS Templates
  • About
  • LinkedIn
  • Twitter
  • YouTube
  • Instagram

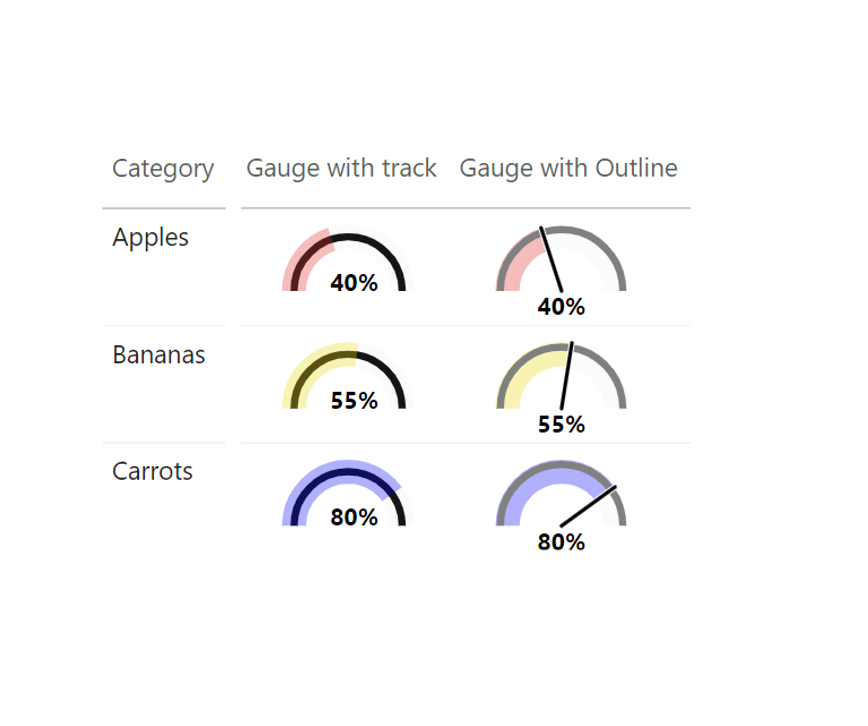
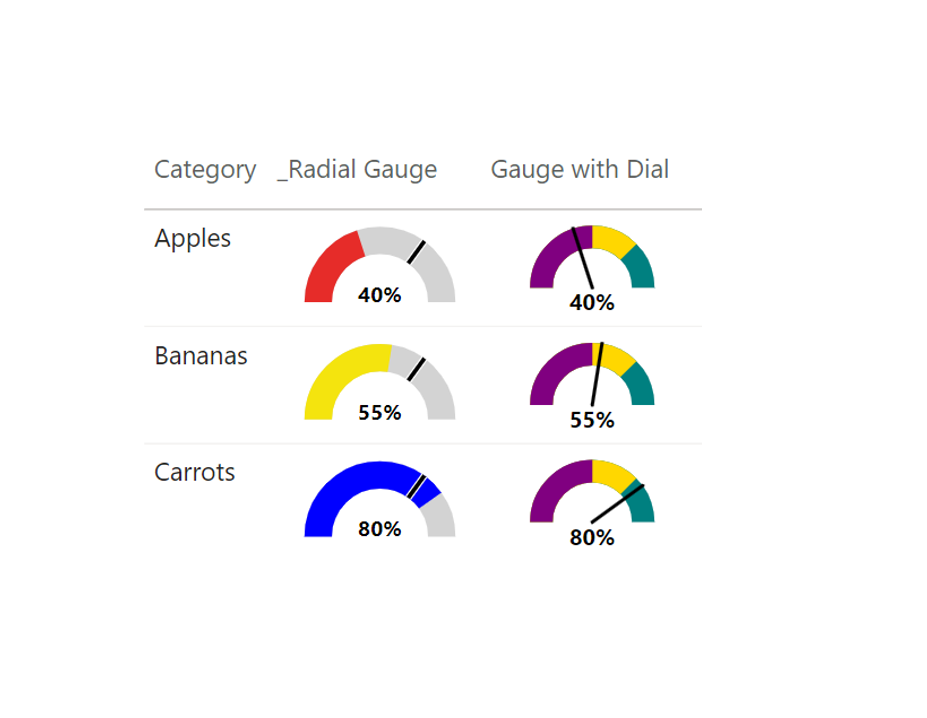
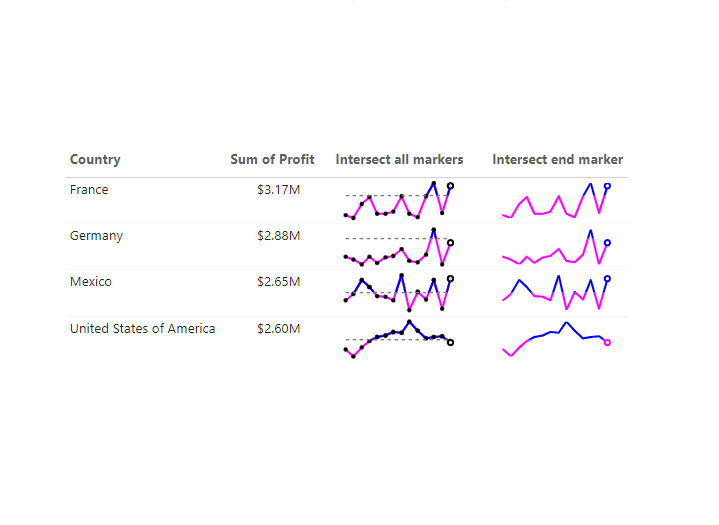
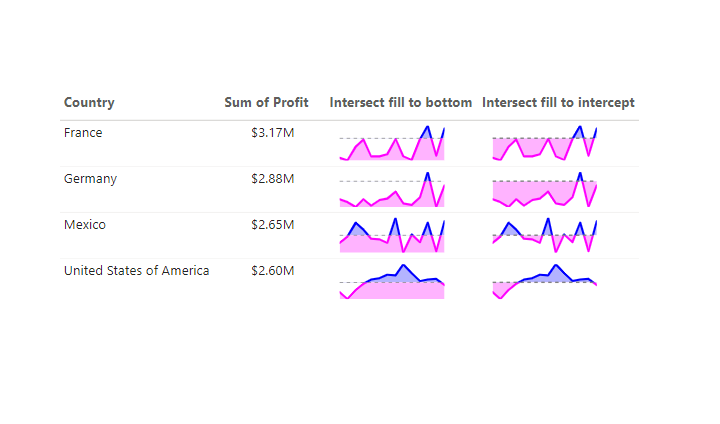
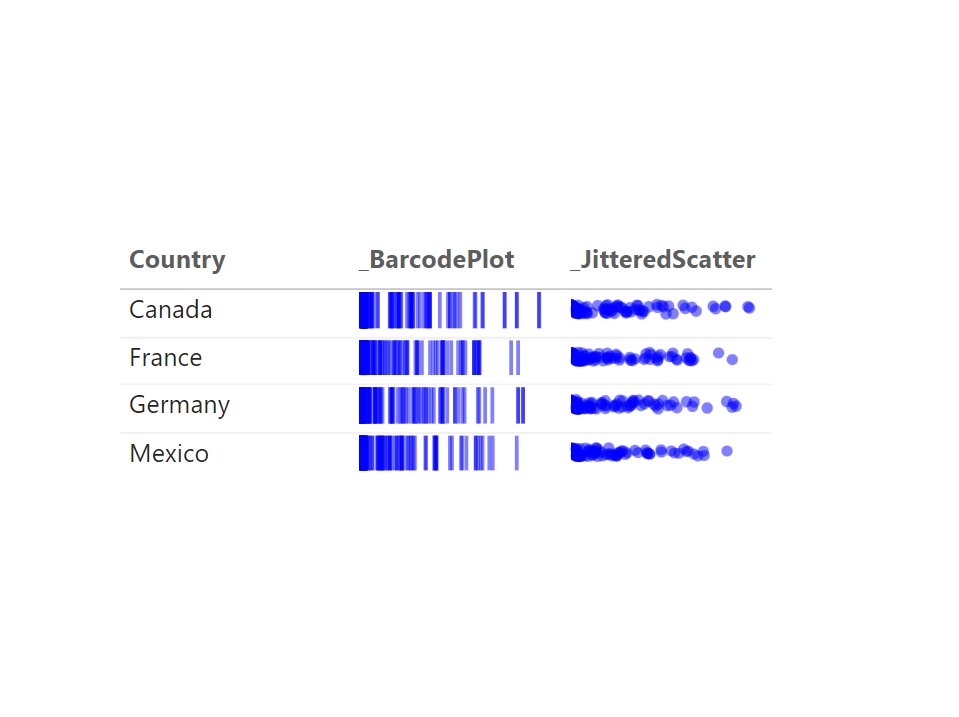
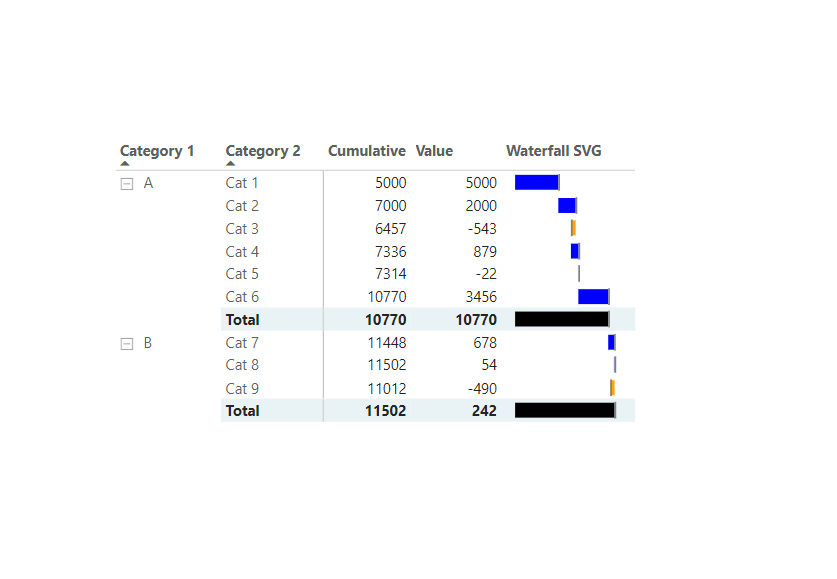
Chart Templates

Templates for various Power BI custom visuals including Deneb and PlotlyJS. Learn how to import a template here. More templates and .pbix files here.

Visual Portfolio, Posts & Image Gallery for WordPress
All
Deneb Templates
PlotlyJS
SVG Templates

image-15

SVG Templates

Progress Bars

image-10

SVG Templates

Circular Gauges

image-13

SVG Templates

Range Bars

image-8

SVG Templates

Sparklines

image-7

SVG Templates

Gradient Sparklines

image-12

SVG Templates

KPI Card

Load More Loading More… You’ve reached the end of the list

Post navigation

Previous post

Visualisations

Next post

Ramblings

Recent Posts

  • KPI trend indicators on Core Visuals
  • Visualise Filters Applied
  • Custom path axis with Charticulator
  • Breaking the Rules
  • Convert to Shape

Archives

Categories

EXPLORATIONS IN DATA STORYTELLING WITH POWER BI