
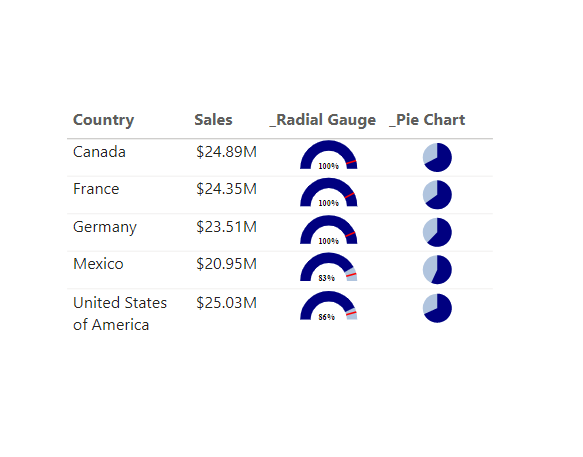
DAX measures to create SVG images for use in matrix or table visuals
Pie
_PieChart =
// Derived from Martens
    // Values
	VAR Percentage =  [SUM Gross Sales]/[Gross Sales Target] // value has to be >= 0 and <=1
	VAR Colour = "navy"
	VAR CirclePercent = 180 - (IF(Percentage > .9999, .9999, Percentage) * 360)
	VAR ShortDistance = if(CirclePercent < 0, 1,0)
	VAR Radians = RADIANS(CirclePercent)
	VAR XArcEnd = sin(Radians)*.8
	VAR YArcEnd = cos(Radians)*.8
    // svg string
	VAR svgHeader =
    "data:image/svg+xml;utf8,<svg width='30' height='30' xmlns:svg='http://www.w3.org/2000/svg' xmlns='http://www.w3.org/2000/svg' viewBox='-1 -1 2 2'>"
	VAR BackgroundArc ="<path d='M 0 -.8 A 0.8 0.8 0 1 1 "&sin(RADIANS(-179.99))*.8&" "& cos(RADIANS(-179.99))*.8&"  L 0 0 z' fill='lightsteelblue'></path>"
	VAR Arc ="<path d='M 0 -.8 A 0.8 0.8 0 " & ShortDistance & " 1 " & XArcEnd & " " & YArcEnd & "  L 0 0 z' fill='" & Colour & "'></path>"
	VAR svgFooter = "</svg>"
    return svgHeader & BackgroundArc & Arc & svgFooter
Radial Gauge
_Radial Gauge =
VAR MAXPlan = [Profit Plan]
VAR MAXActual = [Profit Actual]
VAR MAXTarget = [Profit Target]
VAR AXISRANGE = MAXX(
    {
        MAXPlan,
        MAXActual,
        MAXTarget
    },
    [Value]
)
VAR TRACKWIDTH = MAXPlan/AXISRANGE*100
VAR PERCENTAGEFILL = MAXActual/AXISRANGE
VAR PERCENTAGETARGET = MAXTarget/AXISRANGE
RETURN
"data:image/svg+xml;charset=utf-8, <svg xmlns='http://www.w3.org/2000/svg' xmlns:xlink='http://www.w3.org/1999/xlink' width= '70' height= '30' display= 'block' viewBox='-2 -2 70 70' overflow='visible'>
      <path id='track' fill='none' stroke='lightsteelblue' d='M10,55 a45,45 0 1 1 90,0' stroke-width='20' />
      <path id='fill' fill='none' stroke="&IF(PERCENTAGEFILL<0.50,"'#e62c29'",IF(PERCENTAGEFILL<0.65,"'#F4E40E'","'navy'"))&" d='M10,55 a45,45 0 1 1 90,0' stroke-width='20' stroke-dasharray='141.3717' stroke-dashoffset="&"'"&(1-PERCENTAGEFILL) * (PI()*45)&"'"&"></path>
      <path id='target' fill='none' stroke='red' d='M0,55 L20,55' stroke-width='3' transform='rotate("&PERCENTAGETARGET*180&" 55 55)'/><text x='35' y='55' font-weight='bold' >"&FORMAT(PERCENTAGEFILL, "0%")&"</text>
    </svg>" //Target Marker = Percent of Total * 180 degrees; Gauge Fill = Percent of Total * πr
Hi,
Thanks for your support ofthis scripts.
I have tried and there are only one chart as output. Would you mind to provide more information for this tutorial. And there’s one more concern is that the chart are too tiny to identify, how should I adjust the size ratio for full view. Highly appreciated.
Regards,
Crystal