
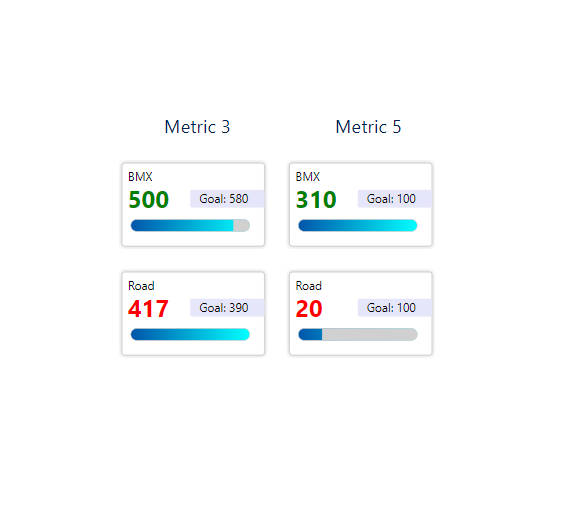
DAX measure to generate SVG image for use in matrix or table visuals
SVG Card Rectangular Shadow =

"data:image/svg+xml;utf8, " &

"<svg xmlns='http://www.w3.org/2000/svg' viewBox='0 0 250 150' overflow='visible'>

  --- Glow Shadow ---

<defs>

<filter id='shadow'><feDropShadow dx='0.2' dy='0.4' stdDeviation='0.2' /></filter>

<filter id='glow'><feDropShadow dx='0' dy='0' stdDeviation='5' flood-color='lightgray'/></filter>

</defs>

  --- Outline ---

<rect x='5' y='5' rx='5' ry='5' width='240' height='140' style='stroke:lightgray; stroke-width:2; fill:white; filter:url(#glow)' />

  --- Section Title ---

    <text text-anchor='left' font-size='15pt' font-family='Segoe UI' x='15' y='35'>"&MAX(MultiKPIs[Unit])&"</text>

  --- KPI Figure ---

    <text text-anchor='left' font-weight= 'bold' font-size='30pt' font-family='Segoe UI' x='15' y='80' fill='"&MAX(MultiKPIs[RAG])&"'>"&IF(MAX(MultiKPIs[Measure])="Percentage",FORMAT(MAX(MultiKPIs[Actual]),"#%"),MAX(MultiKPIs[Actual]))&"</text>

  --- Goal Box ---

  <rect x='120' y='50' rx='3' ry='3' width='125' height='30' fill='lavender'></rect>

  <text text-anchor='left' font-size='15pt' font-family='Segoe UI' x='135' y='72'>Goal: "&IF(MAX(MultiKPIs[Measure])="Percentage",FORMAT(MAX(MultiKPIs[Goal]),"#%"),MAX(MultiKPIs[Goal]))&"</text>

 ------- Gauge-------
   <defs>
    <linearGradient id='linear' x1='0%' y1='0%' x2='100%' y2='0%'>
      <stop offset='0%'   stop-color='#05a'/>
      <stop offset='100%' stop-color='cyan'/>
    </linearGradient>
    <clipPath id='clip-1'>
    <rect x="& "'"& 20+(200-(200-(MAX(MultiKPIs[Actual])/MAX(MultiKPIs[Goal]))*200)) &"'"&" y='100' width="& "'"& (200-(MAX(MultiKPIs[Actual])/MAX(MultiKPIs[Goal]))*200) &"'"&" height='20' />
</clipPath>
  </defs>
  <rect id='track' x='20' y='100' rx='10' ry='10' width='200' height='20' fill='#D0D0D0' stroke='#D0D0D0' stroke-width='0'> </rect>
<rect id='fill' x='20' y='100' rx='10' ry='10' width='200' height='20' fill='url(#linear)' stroke='#D0D0D0' stroke-width='1'><title>Percent: "&'KPI'[KPI Percentage]&"</title></rect>
<rect id='mask' x='20' y='100' rx='10' ry='10' width='200' height='20' fill='#D0D0D0' stroke='#D0D0D0' stroke-width='0' clip-path='url(#clip-1)'></rect>
</svg>"
Hi Kerry, how can we get the pbix file ? please
Hi Kerry, this vizualization is awesome. Can you please explain the MultiKPIs[Unit] and MultiKPIs[RAG] measures? I’m pretty new to power BI so I don’t quite understand what are those. Thank you!
Hi Kerry,
I was trying to work on your KPI card SVG template, but couldn’t able to match DAX measures with mine.
could u please send me pbix file?
Could you please provide me the pbix file, so that it would be easy to understand
Could you please provide me the pbix file
Hi Kerry. I apologize if this is an ignorant question, but all of your other templates have VARs with a final URL returned. This template does not. Is there any chance this template DAX needs to be updated? Apologies if I’m missing something!
Yes, it could be optimised. Not high on my priority though 🙂
Favor puedes pasarme el archivo pbix?
Hi, nice visual, I would like to try it, do you have any instructions o video tutorial??? Thanks for sharing