
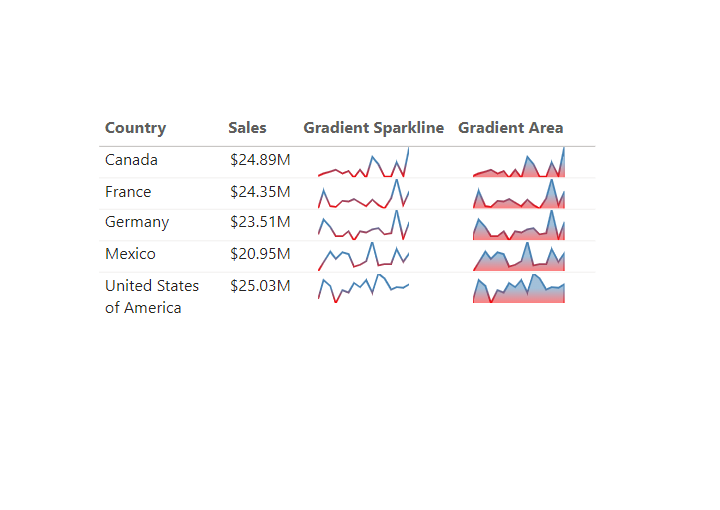
DAX measure to create SVG image for use in matrix or table visuals. Modified from David Eldersveld.
Sparkline
Gradient Sparkline =
// line and area colour - use %23 instead of # for Firefox compatibility (Eldersveld)
VAR Defs = "<defs>
    <linearGradient id='grad' x1='0' y1='25' x2='0' y2='50' gradientUnits='userSpaceOnUse'>
        <stop stop-color='steelblue' offset='0' />
        <stop stop-color='red' offset='1' />
    </linearGradient>
</defs>"
// "Date" field used in this example along the X axis
VAR XMinDate = MIN(financials[Date])
VAR XMaxDate = MAX(financials[Date])

// Obtain overall min and overall max measure values when evaluated for each date
VAR YMinValue = MINX(Values(financials[Date]),CALCULATE([SUM Gross Sales]))
VAR YMaxValue = MAXX(Values(financials[Date]),CALCULATE([SUM Gross Sales]))

// Build table of X & Y coordinates and fit to 50 x 150 viewbox
VAR SparklineTable = ADDCOLUMNS(
    SUMMARIZE('financials',financials[Date]),
        "X",INT(150 * DIVIDE(financials[Date] - XMinDate, XMaxDate - XMinDate)),
        "Y",INT(50 * DIVIDE([SUM Gross Sales] - YMinValue,YMaxValue - YMinValue)))

// Concatenate X & Y coordinates to build the sparkline
VAR Lines = CONCATENATEX(SparklineTable,[X] & "," & 50-[Y]," ", financials[Date])

// Add to SVG, and verify Data Category is set to Image URL for this measure
VAR SVGImageURL = IF(HASONEVALUE(financials[Country]),
    "data:image/svg+xml;utf8," &
    "<svg xmlns='http://www.w3.org/2000/svg' x='0px' y='0px' viewBox='0 0 150 50'>" & Defs &
     "<polyline fill='none' stroke='url(#grad)'
      stroke-width='3' points='" & Lines &
     "'/></svg>",
     BLANK())
RETURN SVGImageURL
Area Sparkline
Gradient Area Sparkline =
// line and area colour - use %23 instead of # for Firefox compatibility (Measure Derived from Eldersveld Modified by Kolosko)
VAR Defs = "<defs>
    <linearGradient id='grad' x1='0' y1='25' x2='0' y2='50' gradientUnits='userSpaceOnUse'>
        <stop stop-color='steelblue' offset='0' />
        <stop stop-color='red' offset='1' />
    </linearGradient>
</defs>"
// "Date" field used in this example along the X axis
VAR XMinDate = MIN(financials[Date])
VAR XMaxDate = MAX(financials[Date])

// Obtain overall min and overall max measure values when evaluated for each date
VAR YMinValue = MINX(Values(financials[Date]),CALCULATE([SUM Gross Sales]))
VAR YMaxValue = MAXX(Values(financials[Date]),CALCULATE([SUM Gross Sales]))

// Build table of X & Y coordinates and fit to 50 x 150 viewbox
VAR SparklineTable = ADDCOLUMNS(
    SUMMARIZE('financials',financials[Date]),
        "X",INT(150 * DIVIDE(financials[Date] - XMinDate, XMaxDate - XMinDate)),
        "Y",INT(50 * DIVIDE([SUM Gross Sales] - YMinValue,YMaxValue - YMinValue)))

// Concatenate X & Y coordinates to build the sparkline
VAR Lines = CONCATENATEX(SparklineTable,[X] & "," & 50-[Y]," ", financials[Date])

// Add to SVG, and verify Data Category is set to Image URL for this measure
VAR SVGImageURL = IF(HASONEVALUE(financials[Country]),
    "data:image/svg+xml;utf8," &
    "<svg xmlns='http://www.w3.org/2000/svg' x='0px' y='0px' viewBox='0 0 150 50'>" & Defs &
     "<polyline fill='url(#grad)' fill-opacity='0.5' stroke='url(#grad)'
      stroke-width='3' points=' 0 50 " & Lines &
      " 150 150 Z '/></svg>",
     BLANK())
RETURN SVGImageURL
How To use /Utilize this DAX!
Actually I am facing some error
There will only be the same formula displayed when I drag The Dax formula into the matrix or table.
Please, someone, assist me. I can’t wait to investigate more visual
Hi there, under measure tools, you will need to change the category of the measure from uncategorised to Image URL
This is amazing, is it possible to use this in the New Card Visual or does the DAX need to be altered