{
  "$schema": "https://vega.github.io/schema/vega-lite/v5.json",
  "usermeta": {
    "deneb": {
      "build": "1.1.0.0",
      "metaVersion": 1,
      "provider": "vegaLite",
      "providerVersion": "5.2.0"
    },
    "interactivity": {
      "tooltip": true,
      "contextMenu": true,
      "selection": false,
      "dataPointLimit": 50
    },
    "information": {
      "name": "Balloons",
      "description": "[No Description Provided]",
      "author": "Kerry Kolosko",
      "uuid": "71e74fbc-cde3-4d23-ad2c-360cf29727a3",
      "generated": "2022-04-12T09:41:44.720Z"
    },
    "dataset": [
      {
        "key": "__0__",
        "name": "Amount",
        "description": "",
        "type": "numeric",
        "kind": "measure"
      }
    ]
  },
  "config": {
    "view": {"stroke": "transparent"}
  },
  "data": {
    "values": [
      {"a": "Balloon A", "b": 120},
      {"a": "Balloon B", "b": 150},
      {"a": "Balloon C", "b": 140},
      {"a": "Balloon D", "b": 190},
      {"a": "Balloon E", "b": 180},
      {"a": "Balloon F", "b": 150},
      {"a": "Balloon G", "b": 110},
      {"a": "Balloon H", "b": 180},
      {"a": "Balloon I", "b": 150}
    ]
  },
  "layer": [
    {
      "mark": {
        "type": "circle",
        "color": {
          "legend": null,
          "x1": 1,
          "y1": 1,
          "x2": 1,
          "y2": 0,
          "r1": 0,
          "r2": 1,
          "gradient": "radial",
          "stops": [
            {
              "offset": 0,
              "color": "white"
            },
            {
              "offset": 1,
              "color": "red"
            }
          ]
        }
      },
      "encoding": {
        "x": {
          "field": "a",
          "type": "nominal",
          "axis": null
        },
        "y": {
          "datum": 100,
          "axis": null
        },
        "size": {
          "field": "b",
          "scale": {
            "rangeMin": 3000,
            "rangeMax": 10000
          },
          "legend": null
        }
      }
    },
    {
      "mark": {
        "type": "line",
        "size": 0.5,
        "color": "black"
      },
      "encoding": {
        "y2": {
          "value": {
            "expr": "(datum.b/3.14)"
          },
          "type": "nominal",
          "axis": {"labelAngle": 0}
        },
        "y": {"datum": 0},
        "x": {
          "field": "a",
          "type": "nominal",
          "axis": {"labelAngle": 0}
        }
      }
    },
    {
      "mark": {
        "type": "text",
        "fontSize": 8,
        "color": "black",
        "angle": -90,
        "baseline": "bottom",
        "align": "bottom"
      },
      "encoding": {
        "y": {"datum": 0},
        "x": {
          "field": "a",
          "type": "nominal"
        },
        "text": {
          "field": "a",
          "type": "nominal"
        }
      }
    },
    {
      "mark": {
        "type": "text",
        "fontSize": 12,
        "color": "black",
        "angle": 0,
        "baseline": "middle",
        "align": "center"
      },
      "encoding": {
        "y": {"datum": 100},
        "x": {
          "field": "a",
          "type": "nominal"
        },
        "text": {
          "field": "b",
          "type": "nominal"
        }
      }
    }
  ]
}

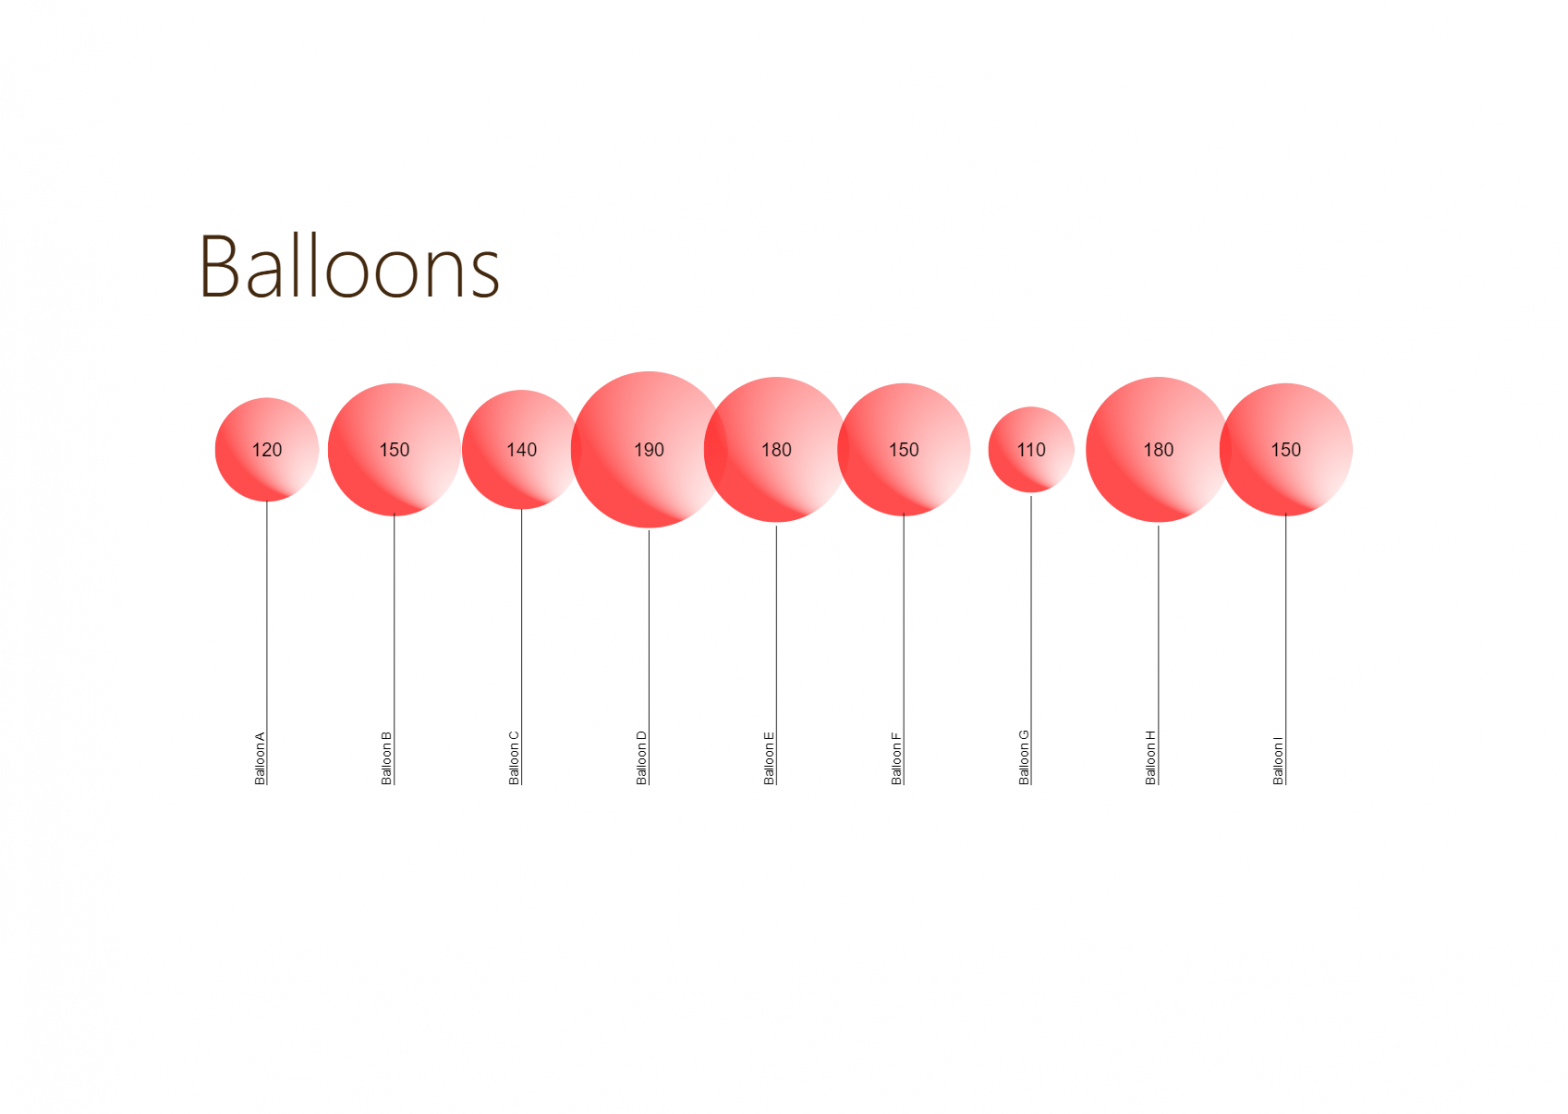
Hi, How can I make the balloon’s high vary?
Sorry but I think this visual is incomplete. It takes “Amount” as input but then what? The amount actually does nothing. This visual is 100% static in current situation. There is no way to dynamically change the visual. Can you add a “Category” besides the “Amount” and then make sure that the category and amount inputs are reflected in the interactivity of this beautiful visual?
Yes, the data is static as it is inline :
“data”: {
“values”: [
{“a”: “Balloon A”, “b”: 120},
{“a”: “Balloon B”, “b”: 150},
{“a”: “Balloon C”, “b”: 140},
{“a”: “Balloon D”, “b”: 190},
{“a”: “Balloon E”, “b”: 180},
{“a”: “Balloon F”, “b”: 150},
{“a”: “Balloon G”, “b”: 110},
{“a”: “Balloon H”, “b”: 180},
{“a”: “Balloon I”, “b”: 150}
]
},
Remove this, and replace with “data”: {“name”: “dataset”}, and this should reference the fields you have dragged into the field well