{
  "$schema": "https://vega.github.io/schema/vega-lite/v5.json",
  "usermeta": {
    "deneb": {
      "build": "1.5.1.0",
      "metaVersion": 1,
      "provider": "vegaLite",
      "providerVersion": "5.6.1"
    },
    "interactivity": {
      "tooltip": true,
      "contextMenu": true,
      "selection": true,
      "highlight": false,
      "dataPointLimit": 50
    },
    "information": {
      "name": "Bar with Leader Lines",
      "description": "[No Description Provided]",
      "author": "Kerry Kolosko",
      "uuid": "700c0e8d-0efc-430e-8663-468e72b52bab",
      "generated": "2023-07-17T01:23:32.341Z"
    },
    "dataset": [
      {
        "key": "__0__",
        "name": "Page",
        "description": "",
        "type": "text",
        "kind": "column"
      },
      {
        "key": "__1__",
        "name": "Pageviews",
        "description": "",
        "type": "numeric",
        "kind": "measure"
      }
    ]
  },
  "config": {
    "autosize": {
      "type": "fit",
      "contains": "padding"
    },
    "padding": {
      "left": 5,
      "top": 20,
      "right": 15,
      "bottom": 50
    },
    "view": {"stroke": "transparent"},
    "font": "Segoe UI",
    "axis": {
      "ticks": false,
      "title": false,
      "grid": false,
      "domain": false,
      "labelColor": "white",
      "labelFontSize": 12,
      "titleFont": "wf_standard-font, helvetica, arial, sans-serif",
      "titleColor": "#252423",
      "titleFontSize": 16,
      "titleFontWeight": "normal"
    },
    "axisQuantitative": {
      "tickCount": 3,
      "grid": true,
      "gridColor": "#C8C6C4",
      "gridDash": [1, 5],
      "labelFlush": false
    },
    "axisX": {"labelPadding": 5},
    "axisY": {"labelPadding": 10},
    "header": {
      "titleFont": "wf_standard-font, helvetica, arial, sans-serif",
      "titleFontSize": 16,
      "titleColor": "white",
      "labelFont": "Segoe UI",
      "labelFontSize": 12,
      "labelColor": "#605E5C"
    },
    "legend": {
      "titleFont": "Segoe UI",
      "titleFontWeight": "bold",
      "titleColor": "#605E5C",
      "labelFont": "Segoe UI",
      "labelFontSize": 12,
      "labelColor": "#605E5C",
      "symbolType": "circle",
      "symbolSize": 75
    }
  },
  "data": {"name": "dataset"},
  "width": 275,
  "height": {"step": 35},
  "mark": {
    "type": "bar",
    "cornerRadiusEnd": 4,
    "height": {"band": 0.8},
    "yOffset": 5,
    "tooltip": true
  },
  "encoding": {
    "y": {
      "field": "__0__",
      "type": "nominal",
      "sort": "-x",
      "title": null,
      "axis": {
        "bandPosition": 0,
        "grid": false,
        "gridColor": "#C8C6C4",
        "gridDash": [1, 5],
        "domain": false,
        "ticks": false,
        "labelAlign": "left",
        "labelBaseline": "middle",
        "labelPadding": -1,
        "labelOffset": -15,
        "titleX": 5,
        "titleY": -5,
        "titleAngle": 0,
        "titleAlign": "left",
        "zindex": 1,
        "blend": "luminosity",
        "labelColor": "grey"
      }
    },
    "x": {
      "field": "__1__",
      "type": "quantitative",
      "title": null,
      "axis": null
    }
  },
  "layer": [
    {
      "mark": {
        "type": "rule",
        "color": "grey",
        "strokeDash": [1, 5],
        "x": "width",
        "xOffset": 260,
        "yOffset": 5,
        "tooltip": false
      },
      "encoding": {
        "x": {
          "datum": 1,
          "type": "quantitative",
          "title": null,
          "axis": null
        }
      }
    },
    {
      "mark": {
        "type": "bar",
        "cornerRadiusEnd": 4,
        "height": {"band": 0.3},
        "tooltip": true
      },
      "encoding": {
        "color": {
          "scale": {
            "range": [
              "#2999AA",
              "#2999AA"
            ]
          },
          "legend": null,
          "field": "__1__",
          "type": "quantitative",
          "title": ""
        },
        "opacity": {
          "condition": {
            "test": {
              "field": "__selected__",
              "equal": "off"
            },
            "value": 0.3
          }
        }
      }
    },
    {
      "mark": {
        "type": "text",
        "align": "right",
        "xOffset": 260,
        "color": "black",
        "strokeWidth": 2,
        "stroke": "white",
        "x": "width",
        "aria": false
      },
      "encoding": {
        "text": {
          "field": "__1__",
          "type": "quantitative",
          "format": ",.0f"
        },
        "x": {
          "datum": 1,
          "type": "quantitative",
          "title": null,
          "axis": null
        }
      }
    },
    {
      "mark": {
        "type": "text",
        "align": "right",
        "xOffset": 260,
        "color": "black",
        "strokeWidth": 0,
        "stroke": "white",
        "x": "width",
        "aria": false
      },
      "encoding": {
        "text": {
          "field": "__1__",
          "type": "quantitative",
          "format": ",.0f"
        },
        "x": {
          "datum": 1,
          "type": "quantitative",
          "title": null,
          "axis": null
        }
      }
    }
  ]
}

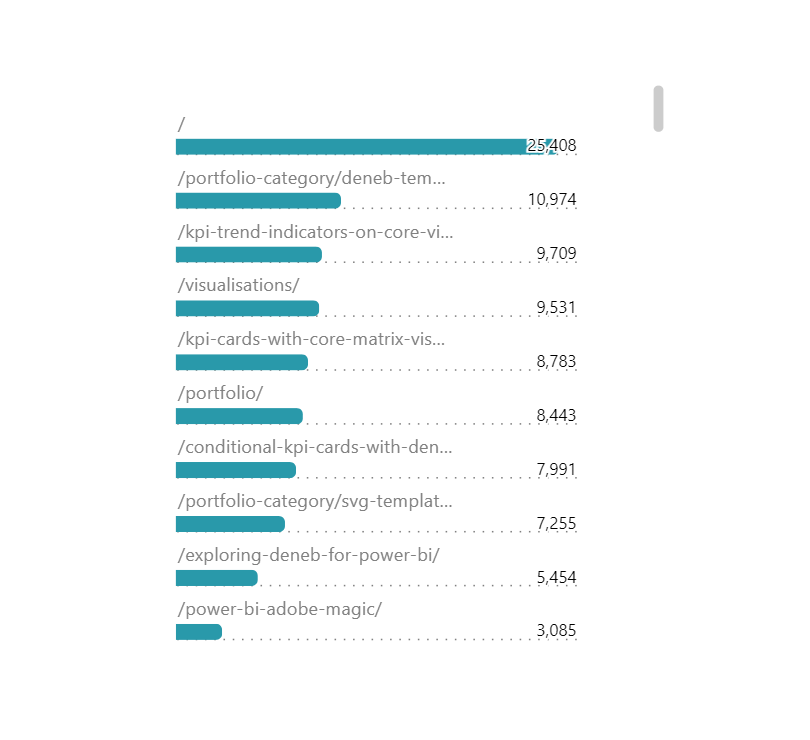
Hi, i am from Brazil and i have a question.
How can i make the number look like “25.408” instead of “25,408”?
I am appreciating all the work you’ve been doing on Deneb.
Many thanks!!!
https://talk.observablehq.com/t/vega-lite-axis-and-tooltip-values-how-to-format-number/6029
Hi,
Thansk for sahring.
How can I do to increase the size of the y axis so that more text characters appear without “…”?
I didn’t want to make the text contracted.
One method is to adjust the offset