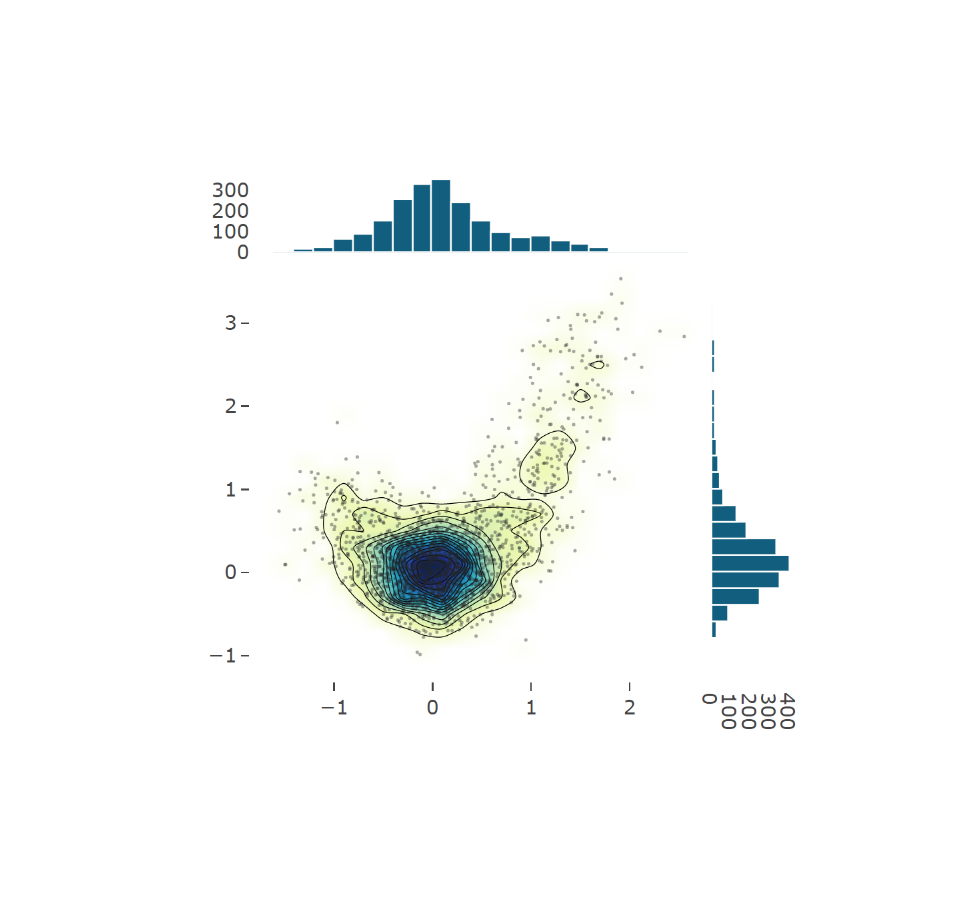
{
  "data": [
    {
"x" : [],
"y":[],
      "mode": "markers",
      "name": "points",
      "marker": {
        "color": "rgb(33, 37, 39)",
        "size": 2,
        "opacity": 0.4
      },
      "type": "scatter"
    },
    {
"x" :[],
"y":[],
      "name": "density",
      "ncontours": 20,
      "colorscale": [
        [
          0,
          "#ffffff"
        ],
        [
          0.125,
          "#edf8b1"
        ],
        [
          0.25,
          "#c7e9b4"
        ],
        [
          0.375,
          "#7fcdbb"
        ],
        [
          0.5,
          "#41b6c4"
        ],
        [
          0.625,
          "#1d91c0"
        ],
        [
          0.75,
          "#225ea8"
        ],
        [
          0.875,
          "#253494"
        ],
        [
          1,
          "#081d58"
        ]
      ],
      "reversescale": false,
      "showscale": false,
      "type": "histogram2dcontour",
      "xbingroup": "X",
      "ybingroup": "Y",
      "contours": {
        "start": 5,
        "end": 75,
        "size": 5,
        "coloring": "heatmap"
      },
      "autocontour": true,
      "autocolorscale": false
    },
    {
"x" :[],
      "name": "x density",
      "marker": {
        "color": "rgb(18, 94, 126)",
        "line": {
          "color": "rgb(255, 255, 255)",
          "width": 1
        }
      },
      "yaxis": "y2",
      "type": "histogram",
      "bingroup": "X"
    },
    {
"y":[],
      "name": "y density",
      "marker": {
        "color": "rgb(18, 94, 126)",
        "line": {
          "width": 1,
          "color": "rgb(255, 255, 255)"
        }
      },
      "xaxis": "x2",
      "type": "histogram",
      "bingroup": "Y",
      "orientation": "h"
    }
  ],
  "layout": {
    "showlegend": false,
    "width": 600,
    "height": 550,
    "margin": {
      "t": 50
    },
    "xaxis": {
      "domain": [
        0,
        0.85
      ],
      "zeroline": false,
      "showgrid": false,
      "type": "linear",
      "range": [
        -1.8276834855217965,
        2.823323761301797
      ],
      "autorange": true
    },
    "yaxis": {
      "domain": [
        0,
        0.85
      ],
      "zeroline": false,
      "showgrid": false,
      "type": "linear",
      "range": [
        -1.2846086303865083,
        3.831809013346508
      ],
      "autorange": true
    },
    "xaxis2": {
      "domain": [
        0.85,
        1
      ],
      "showgrid": false,
      "zeroline": false,
      "range": [
        0,
        415.7894736842105
      ],
      "autorange": true
    },
    "yaxis2": {
      "domain": [
        0.85,
        1
      ],
      "showgrid": false,
      "zeroline": false,
      "range": [
        0,
        365.2631578947368
      ],
      "autorange": true
    },
    "hovermode": "closest",
    "colorway": null,
    "mapbox": {
      "style": "open-street-map"
    },
    "colorscale": {
      "sequential": [
        [
          0,
          "#dcdcdc"
        ],
        [
          0.3333333333333333,
          "#f5c39d"
        ],
        [
          0.6666666666666666,
          "#f5a069"
        ],
        [
          1,
          "#b20a1c"
        ]
      ]
    }
  },
  "frames": []
}

