
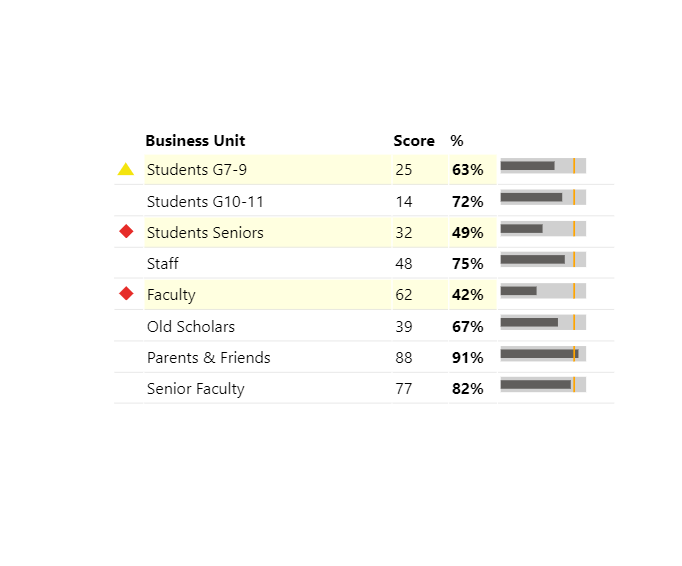
This Table was created with the HTML Content Viewer
<HTML> Linear Gauge Table =
    VAR SourceData =
        ADDCOLUMNS(
            SUMMARIZE(
                'KPI',
                'KPI'[Business Unit]
            ),
            "Score",'KPI'[KPI Score], "%", FORMAT('KPI'[KPI Percentage], "0%"), "KPI", 'KPI'[KPI SVG], "Gauge",'KPI'[Linear Gauge], "KPIFlag", 'KPI'[KPI Flag]
        )
    VAR TableRow =
        CONCATENATEX(
            SourceData,
            "<tr class='"&[KPIFlag]&"'>"
                & "<td>"
                & [KPI]
                & "</td>"
                /* column 1 */
                & "<td style='width: 50%;'>"
                & [Business Unit]
                & "</td>"
                /* column 2 */
                & "<td>"
                & [Score]
                & "</td>"
                /* column 3 */
                & "<td><strong>"
                & [%]
                & "</strong></td>"
                /* column 4 */
                & "<td>"
                & [Gauge]
                & "</td>"
            & "</tr>"
        )
    RETURN
        /* Table Styling */
        "<style>
            table {width: 100%;font-size: 14pt;} td {font-size: 14pt; padding: 3px; border-bottom: 1px solid #ddd;}
            table tr[class='1'] td:first-child + td {background:lightyellow;} td:nth-child(2) + td {background:lightyellow;} td:nth-child(3) + td {background:lightyellow;}
            table tr[class='2'] td:first-child + td {background:lightyellow;} td:nth-child(2) + td {background:lightyellow;} td:nth-child(3) + td {background:lightyellow;}
            table tr[class='3'] td {background:none;}
        </style>"
        /* Table and heading row */
        & "<table>
            <thead>
                <tr>
                    <th></th>
                    <th>Business Unit</th>
                    <th>Score</th>
                    <th>%</th>
                    <th></th>
                </tr>
            </thead>
            <tbody>"
        /* Data */
        & TableRow
        /* End of table */
        & " </tbody>
        </table>"
KPI SVG =
VAR Red = "<div>
<svg width='20' height='20' xmlns='http://www.w3.org/2000/svg' xmlns:xlink='http://www.w3.org/1999/xlink' overflow='visible'>
<rect id='diamond' x='5' y='5' width='12' height='12' fill='#e62c29' transform='rotate(45) translate(5,-10)'/>
</svg>
</div>"
VAR Amber = "<div>
<svg width='20' height='20' xmlns='http://www.w3.org/2000/svg' xmlns:xlink='http://www.w3.org/1999/xlink' overflow='visible'>
<polygon points='10,5 0,20 20,20' style='fill: #F4E40E'/>
</svg>
</div>"
VAR Green = ""
Return
IF('KPI'[KPI Percentage]<0.50,Red,IF('KPI'[KPI Percentage]<0.65,Amber,Green))Linear Gauge =
"<div>
<svg width='100' height='20' xmlns='http://www.w3.org/2000/svg' xmlns:xlink='http://www.w3.org/1999/xlink' overflow='visible'>
<rect id='track' x='0' y='0' width='100' height='18' fill='#D0D0D0'/>
<rect id='fill' x='0' y='4' width="& 'KPI'[KPI Percentage]*100 &" height='10'fill='#605E5C'><title>Percent: "&'KPI'[KPI Percentage]&"</title></rect>
<rect id='marker' x="&Max('KPI'[Target])*100&" y='0' width='2' height='18' fill='orange'></rect>
</svg>
</div>"
Can someone share the pbix file that was used for this. It will help us get this going.
thanks!