
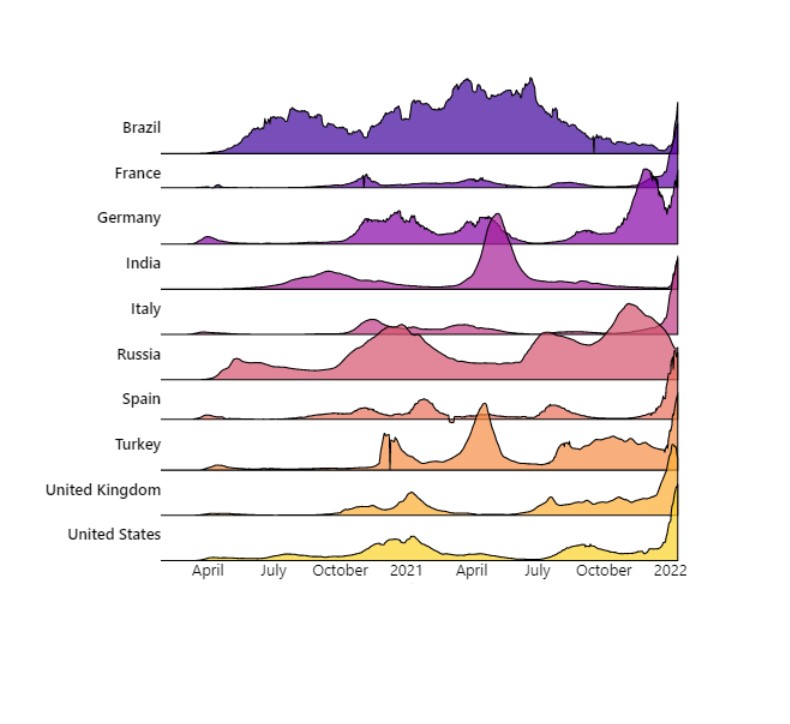
Deneb JSON Template for Joy/Ridgeline plot with independent scales. Remove the resolve line to create dependent scales.
{
  "$schema": "https://vega.github.io/schema/vega-lite/v5.json",
  "usermeta": {
    "deneb": {
      "build": "1.1.0.0",
      "metaVersion": 1,
      "provider": "vegaLite",
      "providerVersion": "5.2.0"
    },
    "interactivity": {
      "tooltip": true,
      "contextMenu": true,
      "selection": false,
      "dataPointLimit": 50
    },
    "information": {
      "name": "Joy Plot Independent Scales",
      "description": "[No Description Provided]",
      "author": "Kerry Kolosko",
      "uuid": "a54446b9-27dd-4587-b1f8-436e7566c141",
      "generated": "2022-02-05T08:05:33.362Z"
    },
    "dataset": [
      {
        "key": "__0__",
        "name": "category",
        "description": "",
        "type": "text",
        "kind": "column"
      },
      {
        "key": "__1__",
        "name": "date",
        "description": "",
        "type": "dateTime",
        "kind": "column"
      },
      {
        "key": "__2__",
        "name": "value",
        "description": "",
        "type": "numeric",
        "kind": "measure"
      }
    ]
  },
  "config": {
    "padding": 0,
    "view": {"stroke": "transparent"},
    "facet": {"spacing": 20},
    "header": {
      "title": null,
      "labelAngle": 0,
      "labelAnchor": "end",
      "labelOrient": "top",
      "labelPadding": -19,
      "labelFontSize": 12,
      "labelFontWeight": 500
    },
    "font": "Segoe UI",
    "area": {
      "fill": {
        "field": "location",
        "type": "nominal",
        "legend": null
      },
      "interpolate": "monotone",
      "stroke": "black"
    },
    "axis": {
      "domain": false,
      "grid": false,
      "labelFontSize": 12,
      "ticks": false,
      "tickCount": 5,
      "titleFontSize": 12,
      "titleFontWeight": 400,
      "titleColor": "#605E5C",
      "offset": 0
    },
    "axisY": {"disable": false},
    "legend": {}
  },
  "data": {"name": "dataset"},
  "bounds": "flush",
  "spacing": 15,
  "mark": {
    "type": "area",
    "fillOpacity": 0.7,
    "strokeOpacity": 1,
    "strokeWidth": 1,
    "interpolate": "monotone"
  },
  "resolve": {
    "scale": {"y": "independent"}
  },
  "width": 400,
  "height": 20,
  "encoding": {
    "x": {
      "title": "__1__",
      "field": "__1__",
      "type": "temporal"
    },
    "y": {
      "aggegrate": "sum",
      "field": "__2__",
      "type": "quantitative",
      "scale": {"range": [20, -40]},
      "axis": {
        "title": null,
        "values": [0],
        "domain": false,
        "labels": false,
        "ticks": false
      }
    },
    "row": {
      "field": "__0__",
      "type": "nominal",
      "title": "__0__",
      "header": {
        "title": null,
        "labelAngle": 0,
        "labelOrient": "left",
        "labelAlign": "left",
        "labelPadding": 0
      },
      "sort": {
        "field": "__0__",
        "op": "max",
        "order": "ascending"
      }
    },
    "fill": {
      "field": "__0__",
      "type": "nominal",
      "legend": null,
      "scale": {"scheme": "plasma"}
    }
  }
}
Great plot!
Can you advise how to include the Date Field in the tooltip, as does not seem to show?
Also I am getting a straight line from the first to the last point.. I can remove it using
“area”: {
“line”: false,
in Config, but it also removes the outside line?
Thanks!
You can specify additional fields in tooltips:
“tooltip”: [
{
“field”: “Value”,
“type”: “quantitative”,
“title”: “Value”,
“format”: “.3f”
},
{
“field”: “feature”,
“type”: “nominal”,
“title”: “Feature Name”
},
{
“field”: “Date”,
“type”: “temporal”,
“title”: “Date”
}
]