
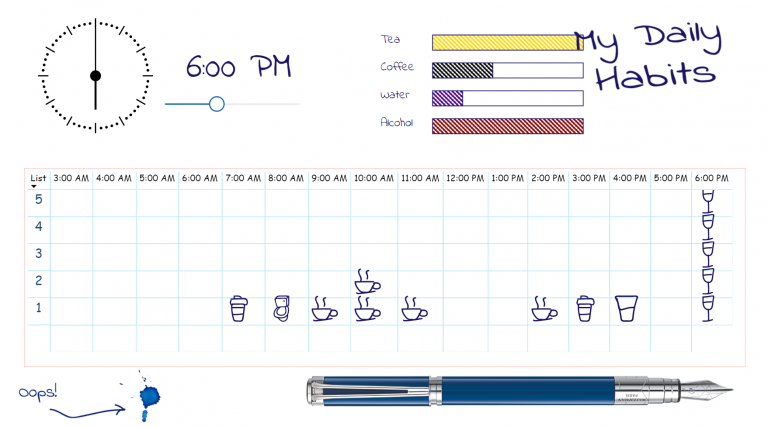
Following Data-Driven SVG Parts 1 & 2; I next explored polygon paths and arcs. The below “infographic” was an exercise in creativity and was never intended to inform. Thus, breaks…
Category: Experimentation
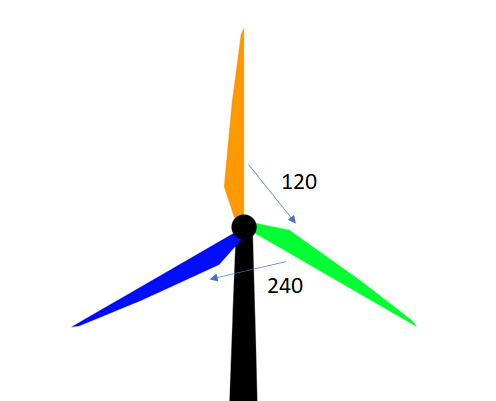
Exploring Data-Driven SVG Part 2 (Rotation)
Having experimented with colour-fill and width I next wanted to play with rotation. How the devil was I to do that? Google is my friend. And so is CSS Tricks.…
Exploring Data-Driven SVG Part 1 (Colour-fill and Size)
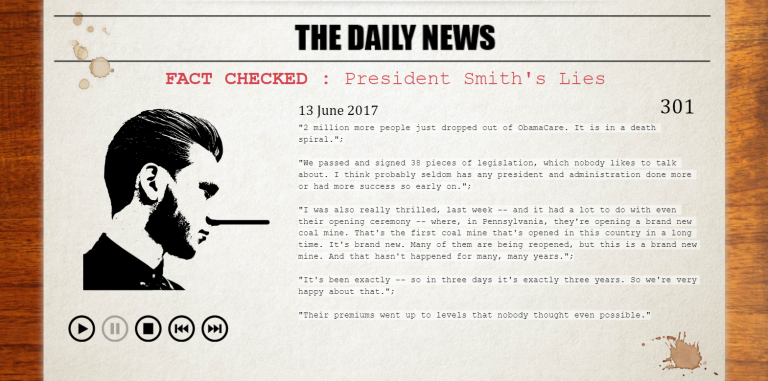
In earlier years of using Power BI I came across an article by David Eldersveld on utilising SVG and colour fill. I was wrapped with the idea and immediately set…