
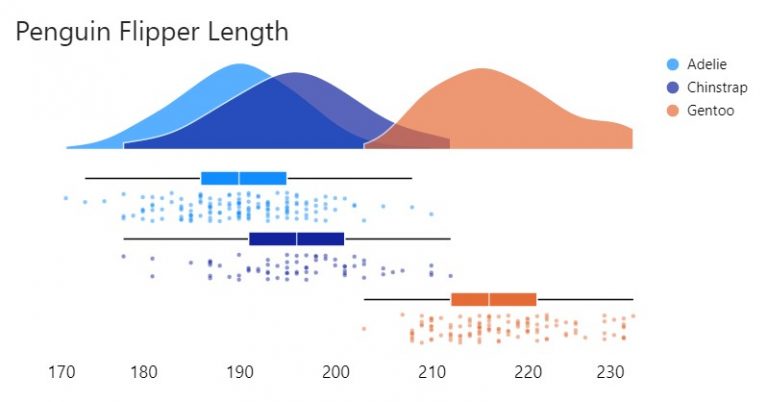
Raincloud plots are a relatively recent and effective addition to the data visualisation toolkit comprising three parts: 1) distributions as density (half-violin plot); 2) summary statistics (box plot) and 3)…
Category: Deneb
Line interpolation
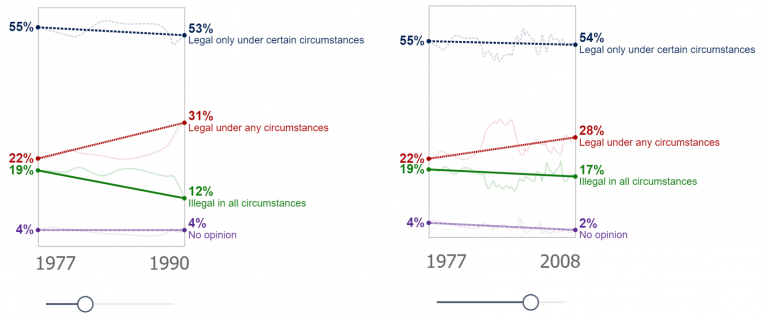
Makeover Monday again! and this time I’m creating a slope graph. Yes, I could achieve this with the core visualisation, but I wouldn’t have as much control as I desired…
Faceted Charts with Deneb
Another creation from a Makeover Monday challenge using Deneb custom visual for Power BI. The original visualisation by Visual Capitalist can be found here. I thought I’d make a slight…
Conditional KPI Cards with Deneb
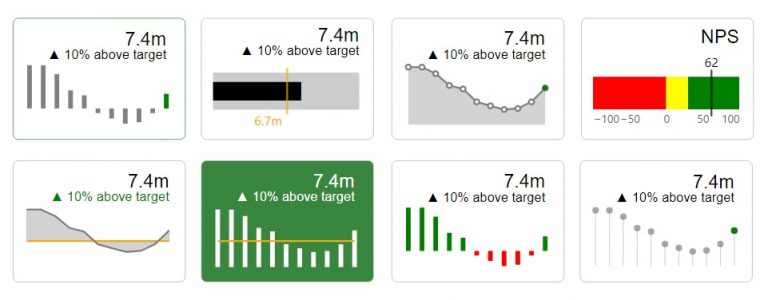
I’d written a piece recently on exploring the Deneb custom visual for Power BI. In that post I touched on KPI Style visuals. I hadn’t seen much in the way…
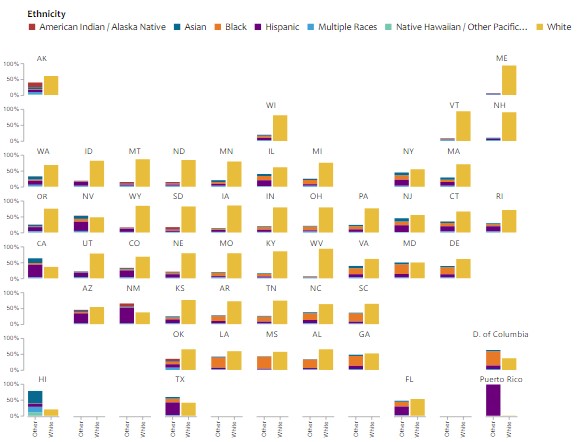
Heatmap with marginal bars
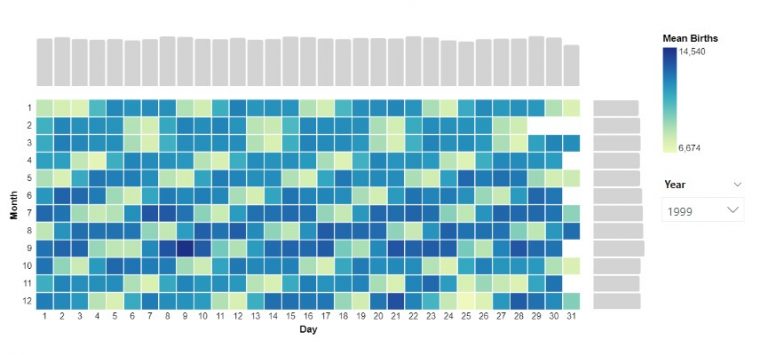
Another visual I explored through a Makeover Monday challenge. To create the chart I installed the latest version of Deneb, dragged the measures I needed into the fields pane. In…
Area between two lines
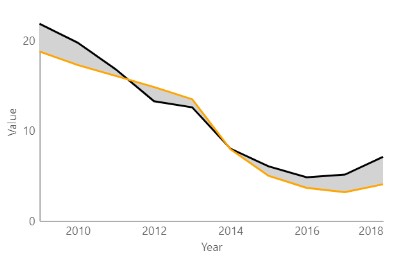
A graph I explored through a Makeover Monday challenge. It didn’t make the final design but I thought I’d write it up for another time. Area fill is sometimes used…
Exploring Deneb for Power BI
In my short career doing data visualization with Power BI, I have always desired the flexibility to do more with my visuals. So when I came across a demo for…