
Creating a bar chart with Deneb is relatively simple when using a category field and a measure. But what about when you have only measures?
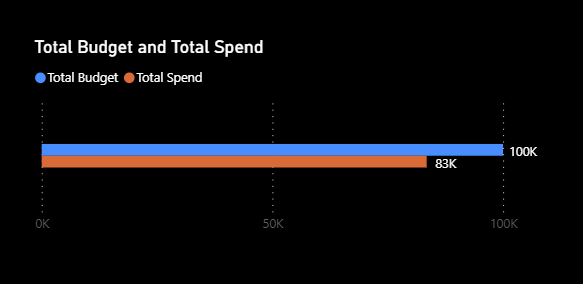
In this particular scenario, I had wanted to use a simple bar chart to display actual vs. target. A bullet chart would have done this, however, didn’t really fill the space nicely and left the page feeling a little out of balance.
The core visual bar chart was also looking a little anemic in this space, so I took to Deneb.
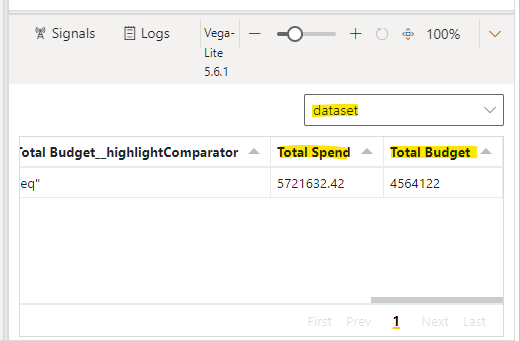
I had two measures, which produced the following table as can be seen within the Deneb Editor:
To have the data in the correct format, I needed to transform the data, using Vega-Lite fold transform.
  "data": {"name": "dataset"},
  "transform": [
    {
      "fold": [
        "Total Spend",
        "Total Budget"
      ]
    }
  ]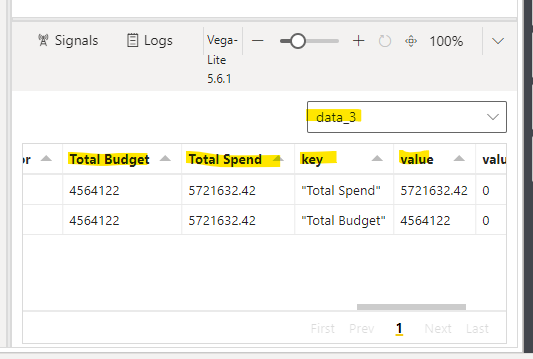
The fold transform works as “unpivot” does in Power Query and returns a key and value for reference in the X and Y encodings.
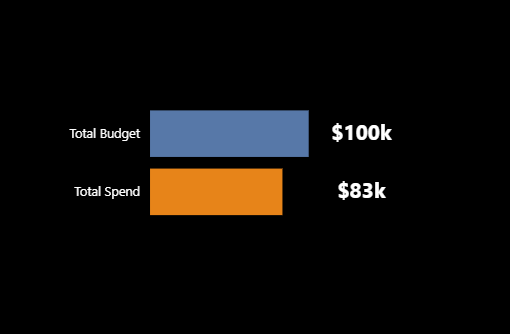
To produce the following simple bar chart:
{
  "data": {"name": "dataset"},
  "transform": [
    {
      "fold": [
        "Total Spend",
        "Total Budget"
      ]
    }
  ],
  "height": {"step": 55},
  "width": 150,
  "layer": [
    {
      "mark": "bar",
      "encoding": {
        "y": {
          "field": "key",
          "type": "nominal",
          "title": null,
          "axis": {
            "labelColor": "white", "labelFontSize" : 12
          },
          "scale": {
            "paddingInner": 0.2,
            "paddingOuter": 0.1
          }
        },
        "x": {
          "field": "value",
          "type": "quantitative",
          "axis": null
        },
        "color": {
          "field": "key",
          "type": "nominal",
          "legend": null
        }
      }
    },
    {
      "mark": {
        "type": "text",
        "x": "width",
        "dx": 50,
        "color": "white",
        "size": 20,
        "fontWeight" : "bold"
      },
      "encoding": {
        "y": {
          "field": "key",
          "type": "nominal",
          "title": null
        },
        "text": {
          "field": "value",
          "type": "quantitative",
          "format": "$.2s"
        }
      }
    }
  ]
}